BENOCS Analytics shows where a flow leaves a network on a router (Egress Router dimension) and peer (Nexthop AS dimension) level mainly from BGP information. Our customers kept asking for one thing:
“Can we filter by the exact interface and see traffic flows?”
Yes, now you can!
Our new interface dimension lets you see both in-interface and out-interface per flow automatically, so you don’t have to trace packets manually.
This post covers why it matters, what has changed, and how BENOCS’ new interface dimension works.
Why it matters
In many networks, bundled/aggregated links create a neat and easy 1 Interface ↔ 1 Nexthop AS mapping. From Egress Router and Nexthop AS, you can often deduce the interface, but that’s not always the case. Take for example:
- Multiple parallel (non-bundled) routes to the same Nexthop AS: You want to know which link carried the flow, mainly for capacity planning, traffic engineering and troubleshooting .
- IXP scenarios: Several Nexthop AS values may share the same physical interface. You still want to see the exact interface that is used.
In these cases, the exact in-interface and out-interface makes a difference.
With this new feature you can:
- Perform per router, per peer, per interface traffic checks.
- Compare loads across parallel routes.
- Trace a spike to a single ingress port.
- Give peering and capacity teams clean evidence.
- Help first-line NOC cut guesswork.

What exactly has changed?
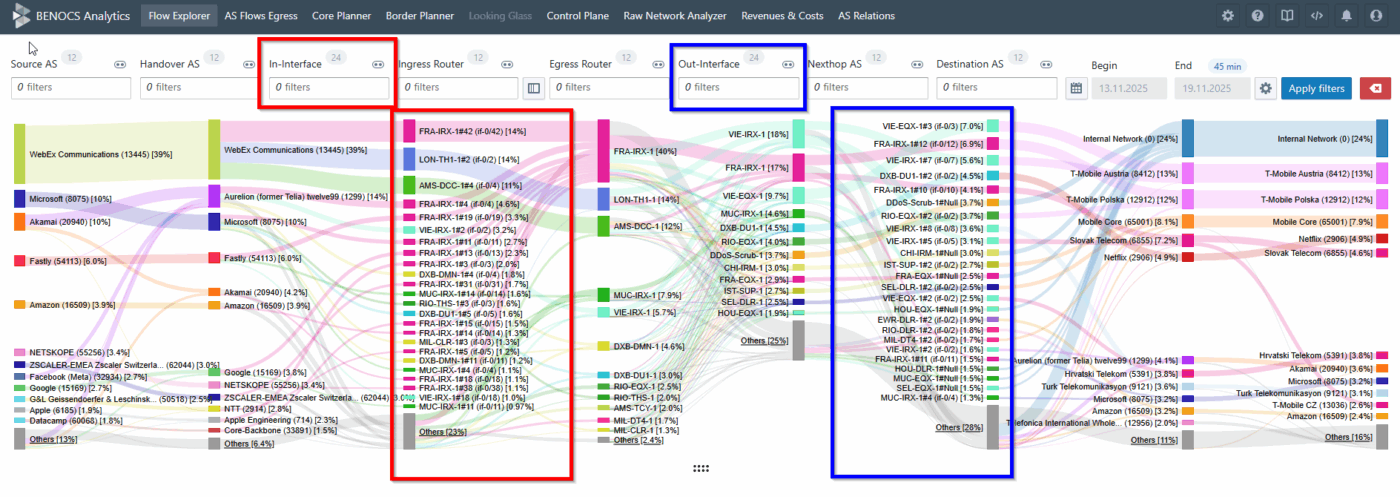
There is a whole new interface dimension in Flow Explorer!
You can now:
- Filter by router, interface or the peer connected to it
- See the interface name (e.g. AE 1.0) and index (e.g. 139)
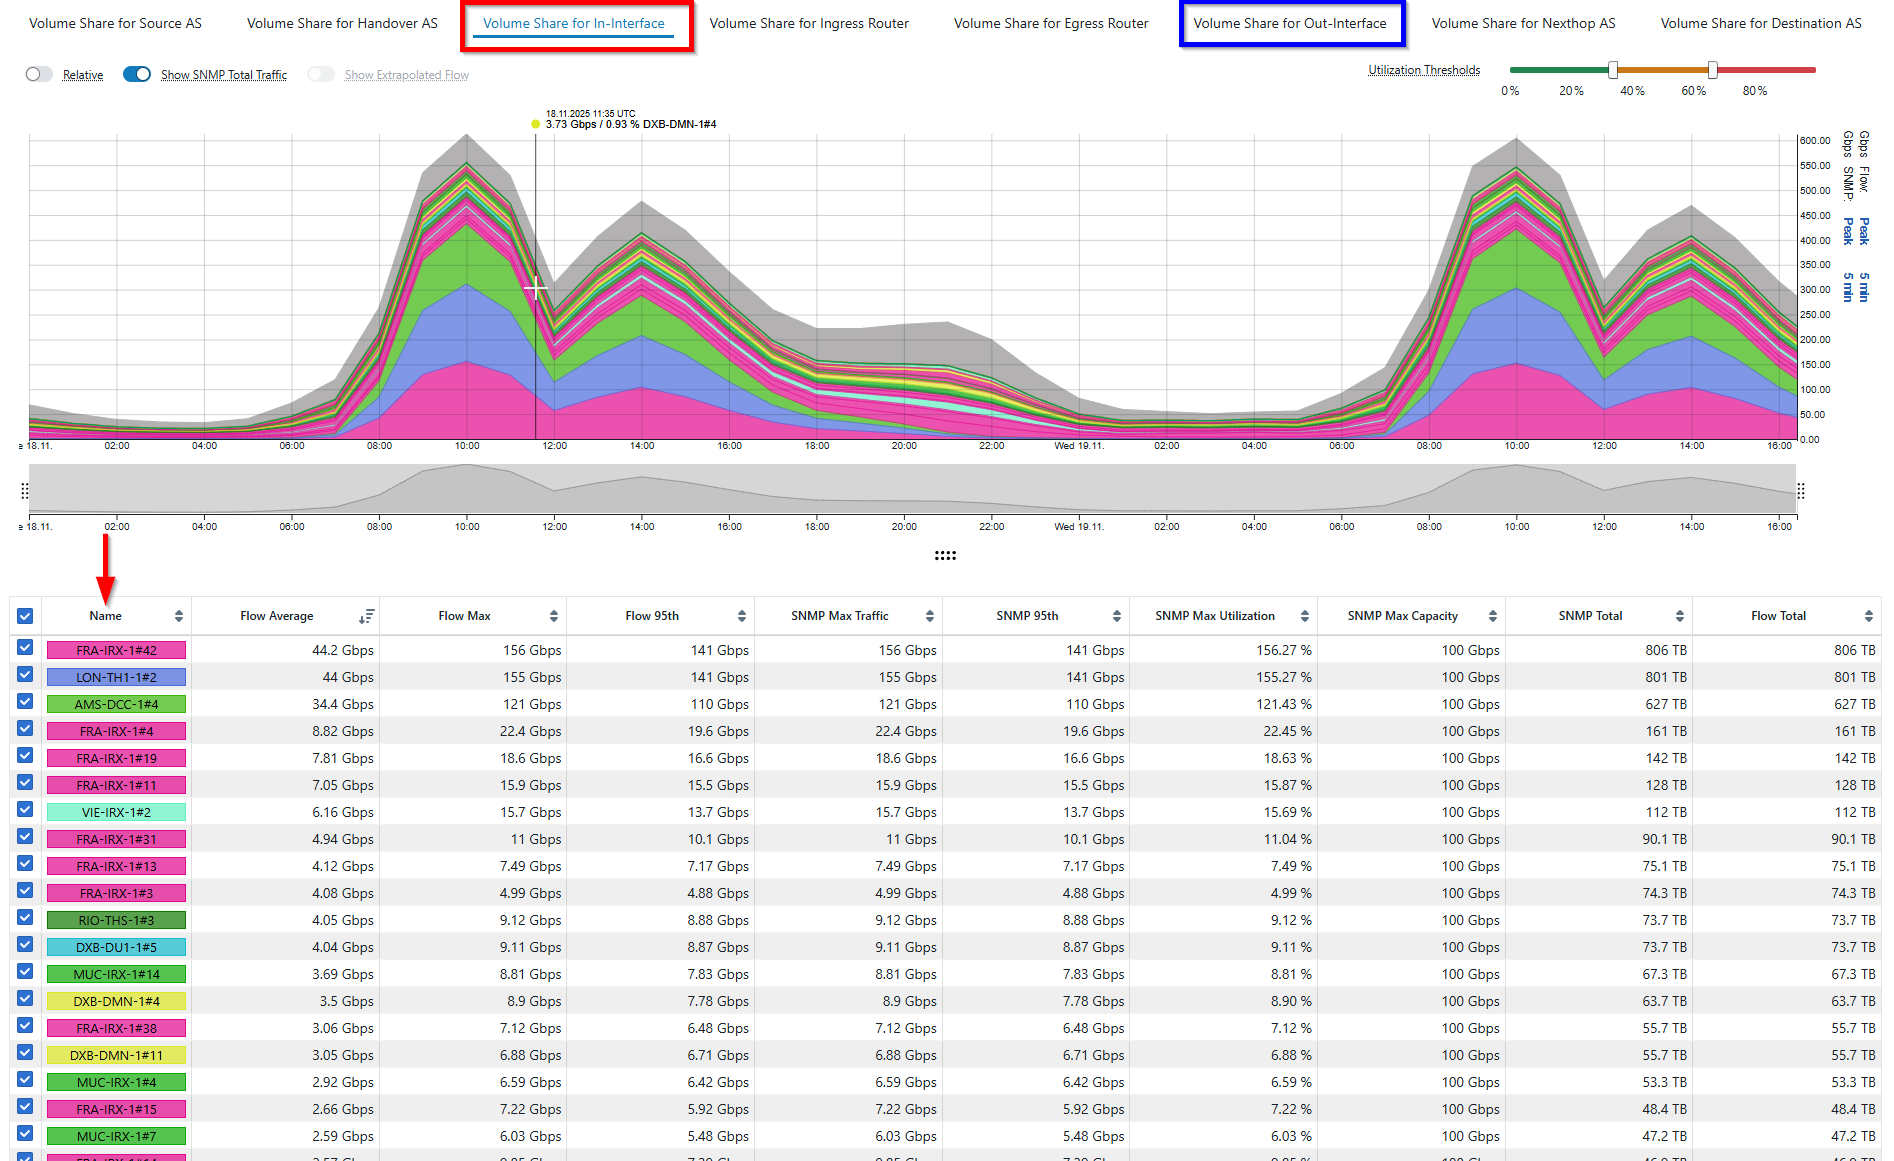
- View both in-interface and out-interfaces of ingress and egress routers
- Hover over a particular interface to see the interface description
- Use autocomplete to find ports fast
This is part of the overall BENOCS Flow Analytics improvement. It is free for all our customers and users!
Interface description is now live in Border Planner, and soon support will be extended to Raw Network Analyzer (RNA).
How it works
- Open presets and pick interface level
- Filter by either router or peer and deep dive into different interfaces.
- Hover over any interface to see description, name and index.
- Switch between in-interface and out-interface dimension above time series to focus on the volume share and all info in the statistics table.
- Additionally, interface description support has been extended to Border Planner too.
- In Border Planner, right-click and choose “Show ingress in Flow Explorer” to filter the specific interface.
What we need from you (clean data tips)
- Enable flow export on core-facing interfaces (ingress) that feed your egress routers.
- Verify router/interface metadata (labels, names) are consistent so that reports look the way you expect.
- Contact your BENOCS representative to turn on Interface dimension and validate if everything looks right in your Analytics dashboard.
Frequently asked questions
Is this a paid add on?
No, it’s completely free.
Where else will I see it?
Interface descriptions are live in Border Planner. Support will be extended to RNA
Will it work for IXPs?
Yes, when multiple nexthop AS values share the same physical interface (common at IXPs), the feature reports the actual interface used.
