
Now that the 2026 FIFA World Cup has concluded, it’s a good time to take an in-depth look at the telemetry data on network traffic and viewer behavior that defined this tournament.
As we discussed in the first part of this series, historical telemetry from the 2018 and 2022 tournaments highlighted a massive transition toward Internet-first broadcasting. We also anticipated that the 2026 tournament—hosted across North America and whose matches run late into the night in Europe—would require a new approach to telemetry data analysis.
To meet this challenge, we leveraged the BENOCS Application Identifier module. By extending our visibility beyond the traditional network view to the Application view, we enriched purely network-level data with useful application-level information.
The following analysis investigates the hidden infrastructures that supported most of the streaming traffic, the uncertainty of daily traffic peaks, and how nighttime human behavior directly drives spikes in network usage.
(To maintain confidentiality, all telemetry data presented here has been normalized and anonymized.)
Historical evolution: 2018 to 2026
When we previously analyzed the shift between the 2018 and 2022 FIFA World Cups, the 3.6x growth in peak streaming traffic clearly illustrated the complete transition to a unicast OTT (Over-The-Top) streaming-first consumption model. However, the telemetry data from the 2026 FIFA World Cup reveals an even more extreme trajectory.
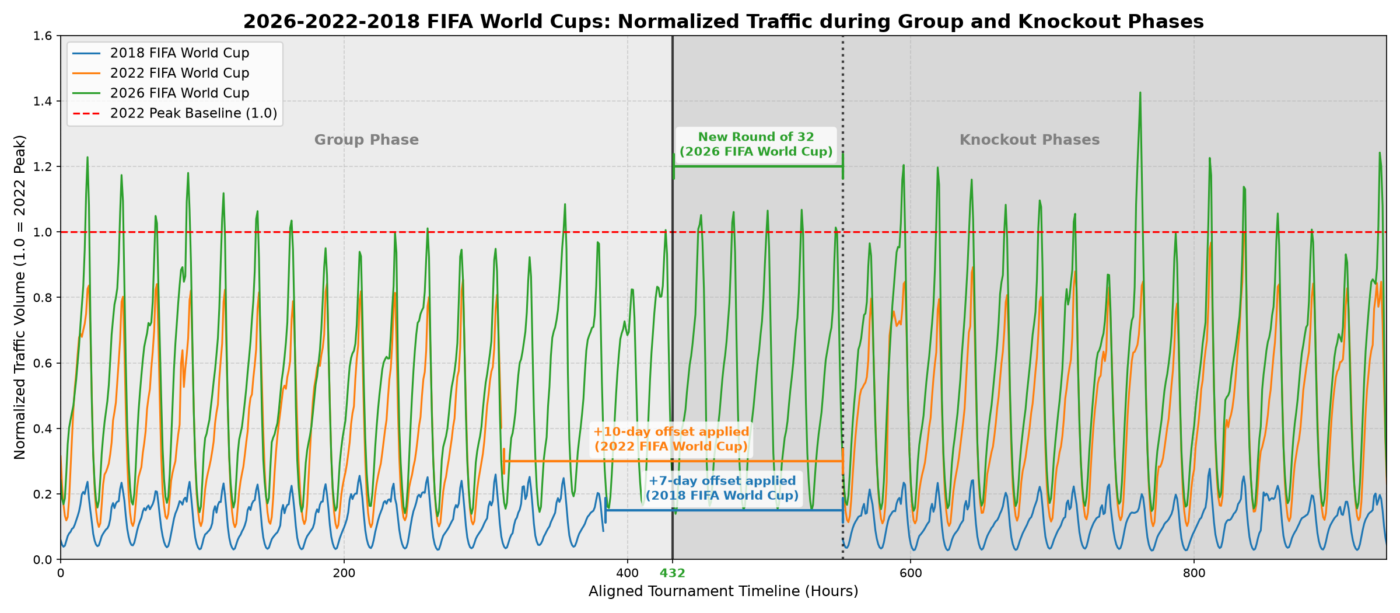
By maintaining our established historical baseline—where 1.0 represents the absolute highest ingress peak recorded during the 2022 FIFA World Cup in Qatar—the incoming data from the 2026 tournament immediately overflows the scale:
- Breaking the baseline early: Network operators prepare for maximum impact during the knockout rounds and finals. But in 2026, the Group Stage went beyond the peak much earlier, specifically during the opening ceremony and first match on June 11.
- Expanded tournament format: The 2026 FIFA World Cup had 48 teams, making this edition much longer than usual. Since the Group Stage was longer, we set the hour 432 as the starting point for the Knockout Phases.
- The new round of 32: The Knockout Phase was made longer by adding a new “Round of 32”. To visualize and compare this change, lags of +168 hours (+7 days) and +240 hours (+10 days) were applied to the 2018 and 2022 datasets, respectively.
All previous tournament characteristics generated intentional “gaps” in the historical timelines. These gaps perfectly illustrate how much longer ISPs had to handle the heavy traffic of the 2026 Group Phase, even before the Knockout Phase began.
Deconstructing public-CDN traffic: Isolating the application layer
While network-layer telemetry illustrates the massive volume of data flowing through the network, it only tells half the story. Public CDNs—such as Amazon, Akamai, and Fastly—are very efficient at distributing/splitting the delivery workload. However, these networks act as universal pipes, simultaneously delivering thousands of unrelated applications, software updates, and other streaming services, as well as football matches.
To accurately measure the tournament’s real impact, we need to look beyond the network layer. By using data from the application layer, we can identify the unique patterns of the official 2026 FIFA World Cup streaming services and directly map them with the total incoming traffic from public CDNs.
For this analysis, the application telemetry was filtered and categorized into two primary broadcasting models:
- Public broadcast streams: These cover the main national public broadcasting streams.
- Premium streams: Grouping the dedicated premium OTT streams and associated online platforms.
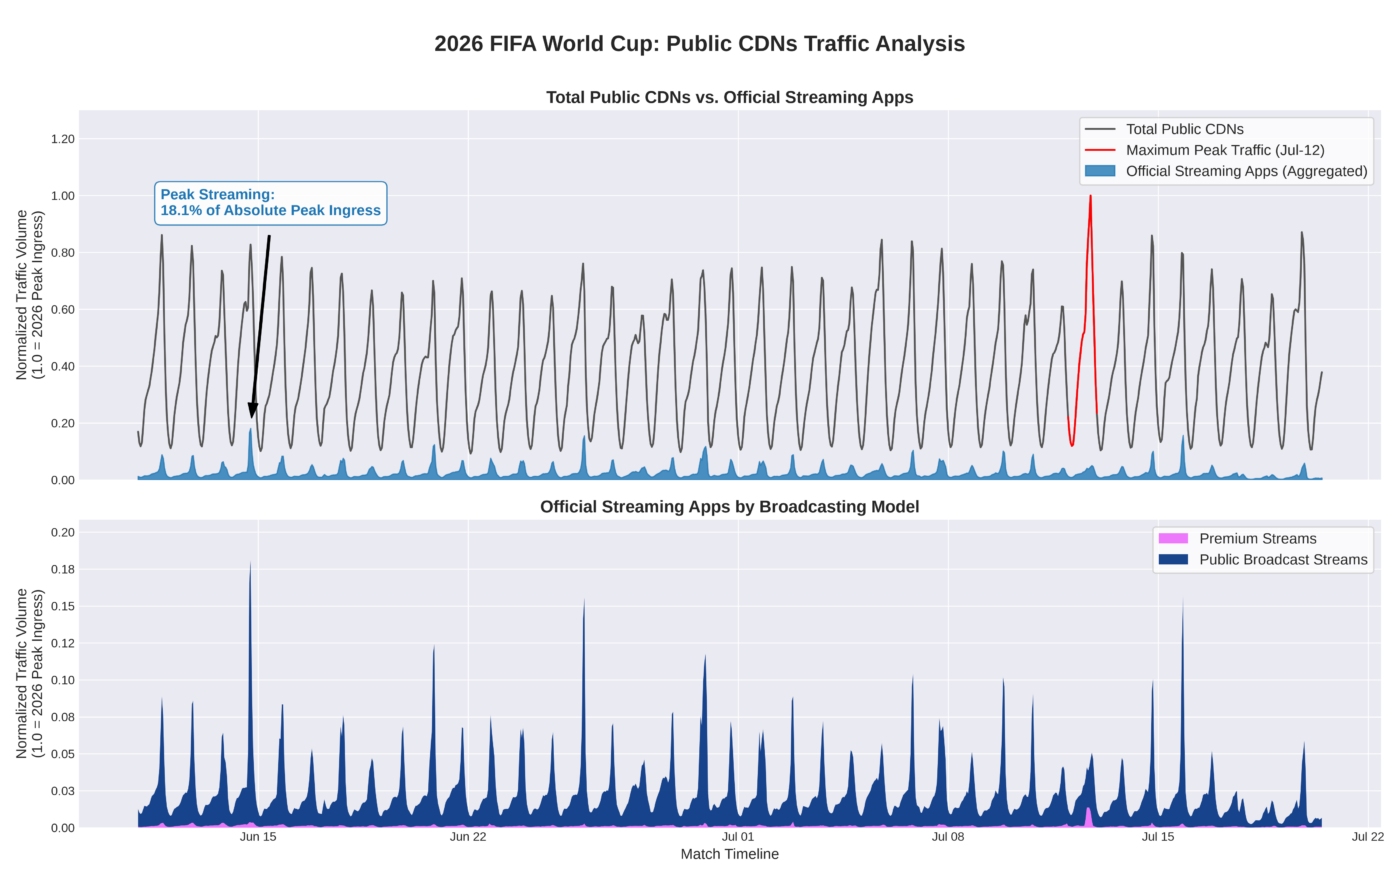
Looking at the “macro view” above, we can see that during peak traffic periods in the group stage, the official streaming apps alone accounted for up to 18.1% of the total inbound network traffic across all monitored public CDNs.
Paying attention to the “micro view” at the bottom reveals the distribution of traffic among the official streaming services. It illustrates a strong dependence on public broadcast streams compared to premium streams, specifically when only public CDNs are considered.
This “macro/micro view” visualization highlights why application-aware visibility is important for high-performance networks. Relying only on ASN-level data can hide the root causes of congestion. By isolating the specific services that generate traffic spikes, network operators can implement smarter peering strategies, optimize caching, and redirect traffic during global streaming events.
Hiding in plain sight: The Wimbledon effect on a rest day
Looking closely at the macro view of the figure above, an obvious anomaly stands out: the absolute maximum peak of the entire analyzed period occurred on July 12 (highlighted by a red line). However, July 12 falls within the two-day pause in the World Cup schedule. Aggregate network traffic did not show the expected decrease; instead, there was a massive increase at midday.
What caused this unprecedented spike? The 2026 Wimbledon Men’s Singles Final.
To demonstrate this, we once again leveraged our Application Identifier feature. By correlating flow and DNS data, we can accurately determine where traffic originates and identify specific applications and services (such as video, gaming, OS updates, etc.) based on DNS CNAME/A-record pairings.
The following figure shows the telemetry data from July 12. As the stacked area chart demonstrates, traffic from the official tennis streaming app spiked between 15:05 and 18:57 UTC. During this exact period, the official World Cup applications remained, as expected, at a low baseline level.
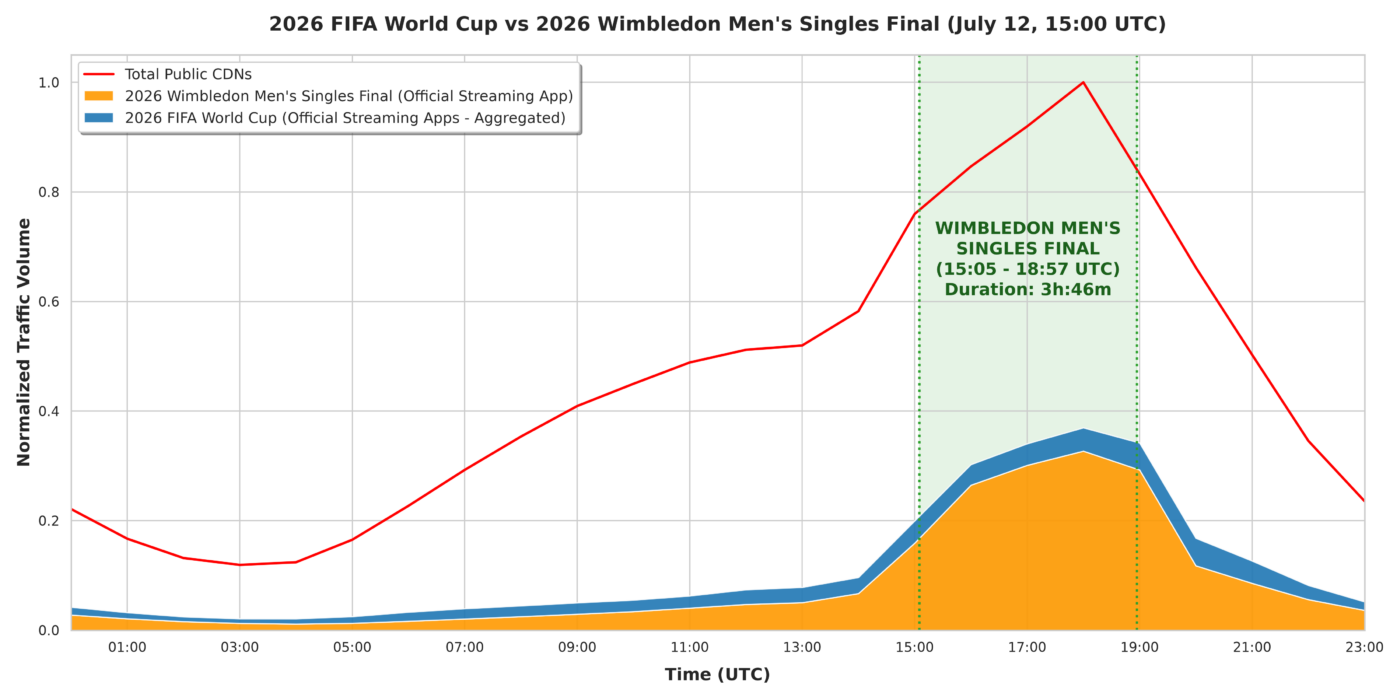
This event highlights the crucial importance of application-level visibility for network operators. Without this flow and DNS correlation, this massive streaming event would simply look like an unexplained, anomalous wave of generic CDN traffic. Without identifying the root cause, it is extremely difficult to attribute the sudden increase to its actual source and/or optimize the network accordingly.
Uncovering the "hidden" streaming infrastructure
When monitoring global live-streaming events, focusing only on public CDNs can create a massive analytical blind spot. If an operator only filters for known public delivery networks, the resulting traffic volume represents only a fraction of the actual World Cup consumption.
To find the missing bandwidth, we must change our telemetry filters from the network layer to the application layer. By tracking the same official streaming apps regardless of the network they traverse, a completely different infrastructure map emerges.
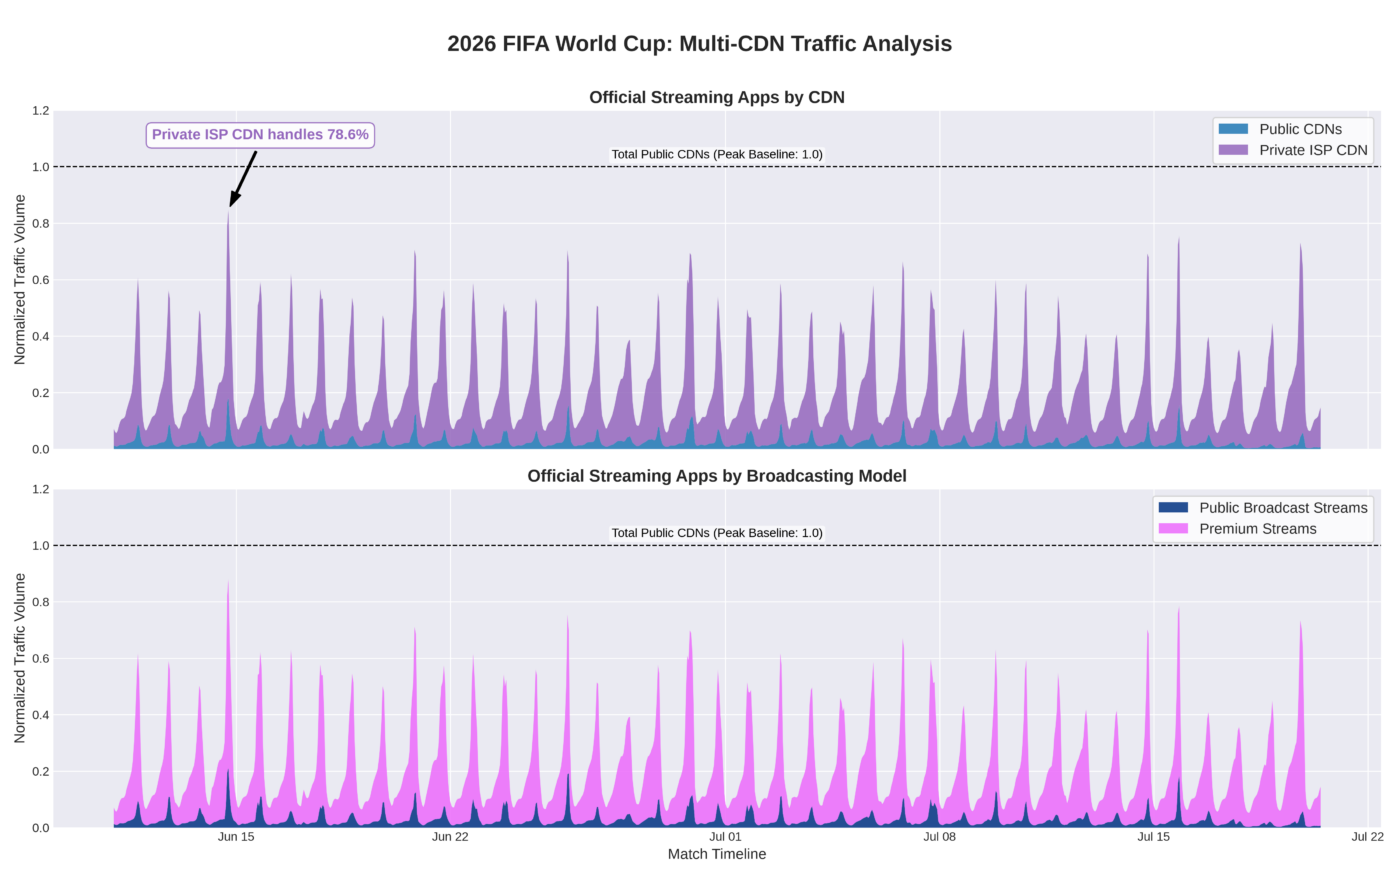
For this analysis, the baseline (1.0) represents the absolute peak traffic across all public CDNs.
The Private ISP Backbone
Application-layer filtering reveals that the vast majority of the 2026 FIFA World Cup streaming traffic does not traverse the public CDN ecosystem at all. Instead, it is being offloaded onto a dedicated, private ISP delivery network.
When we combine traffic from both the public CDNs and this private infrastructure, we see that these two official streaming apps account for the entire traffic volume in this dataset. The scale of this private infrastructure is impressive:
- Public CDNs: Handled a fraction of the World Cup application traffic.
- Private ISP CDN: Absorbed a massive peak volume, increasing to almost 3.6 times the traffic handled by the public CDNs for these apps.
At peak demand, the private network accounted for 78.6% of the total streaming payload.
Without application-aware telemetry, this massive increase would appear to be an unexplained spike in the private backbone network. By correlating applications directly with ASNs, network engineers can identify the source of congestion and proactively manage capacity for future high-impact streaming events.
The anatomy of a match: Hydration breaks, extra time, and penalties
Moving from the tournament’s global perspective to a single-match timeline allows us to see human behavior reflected in network traffic. As anticipated in Part 1, the North American time zones meant that many matches were played during the European night.
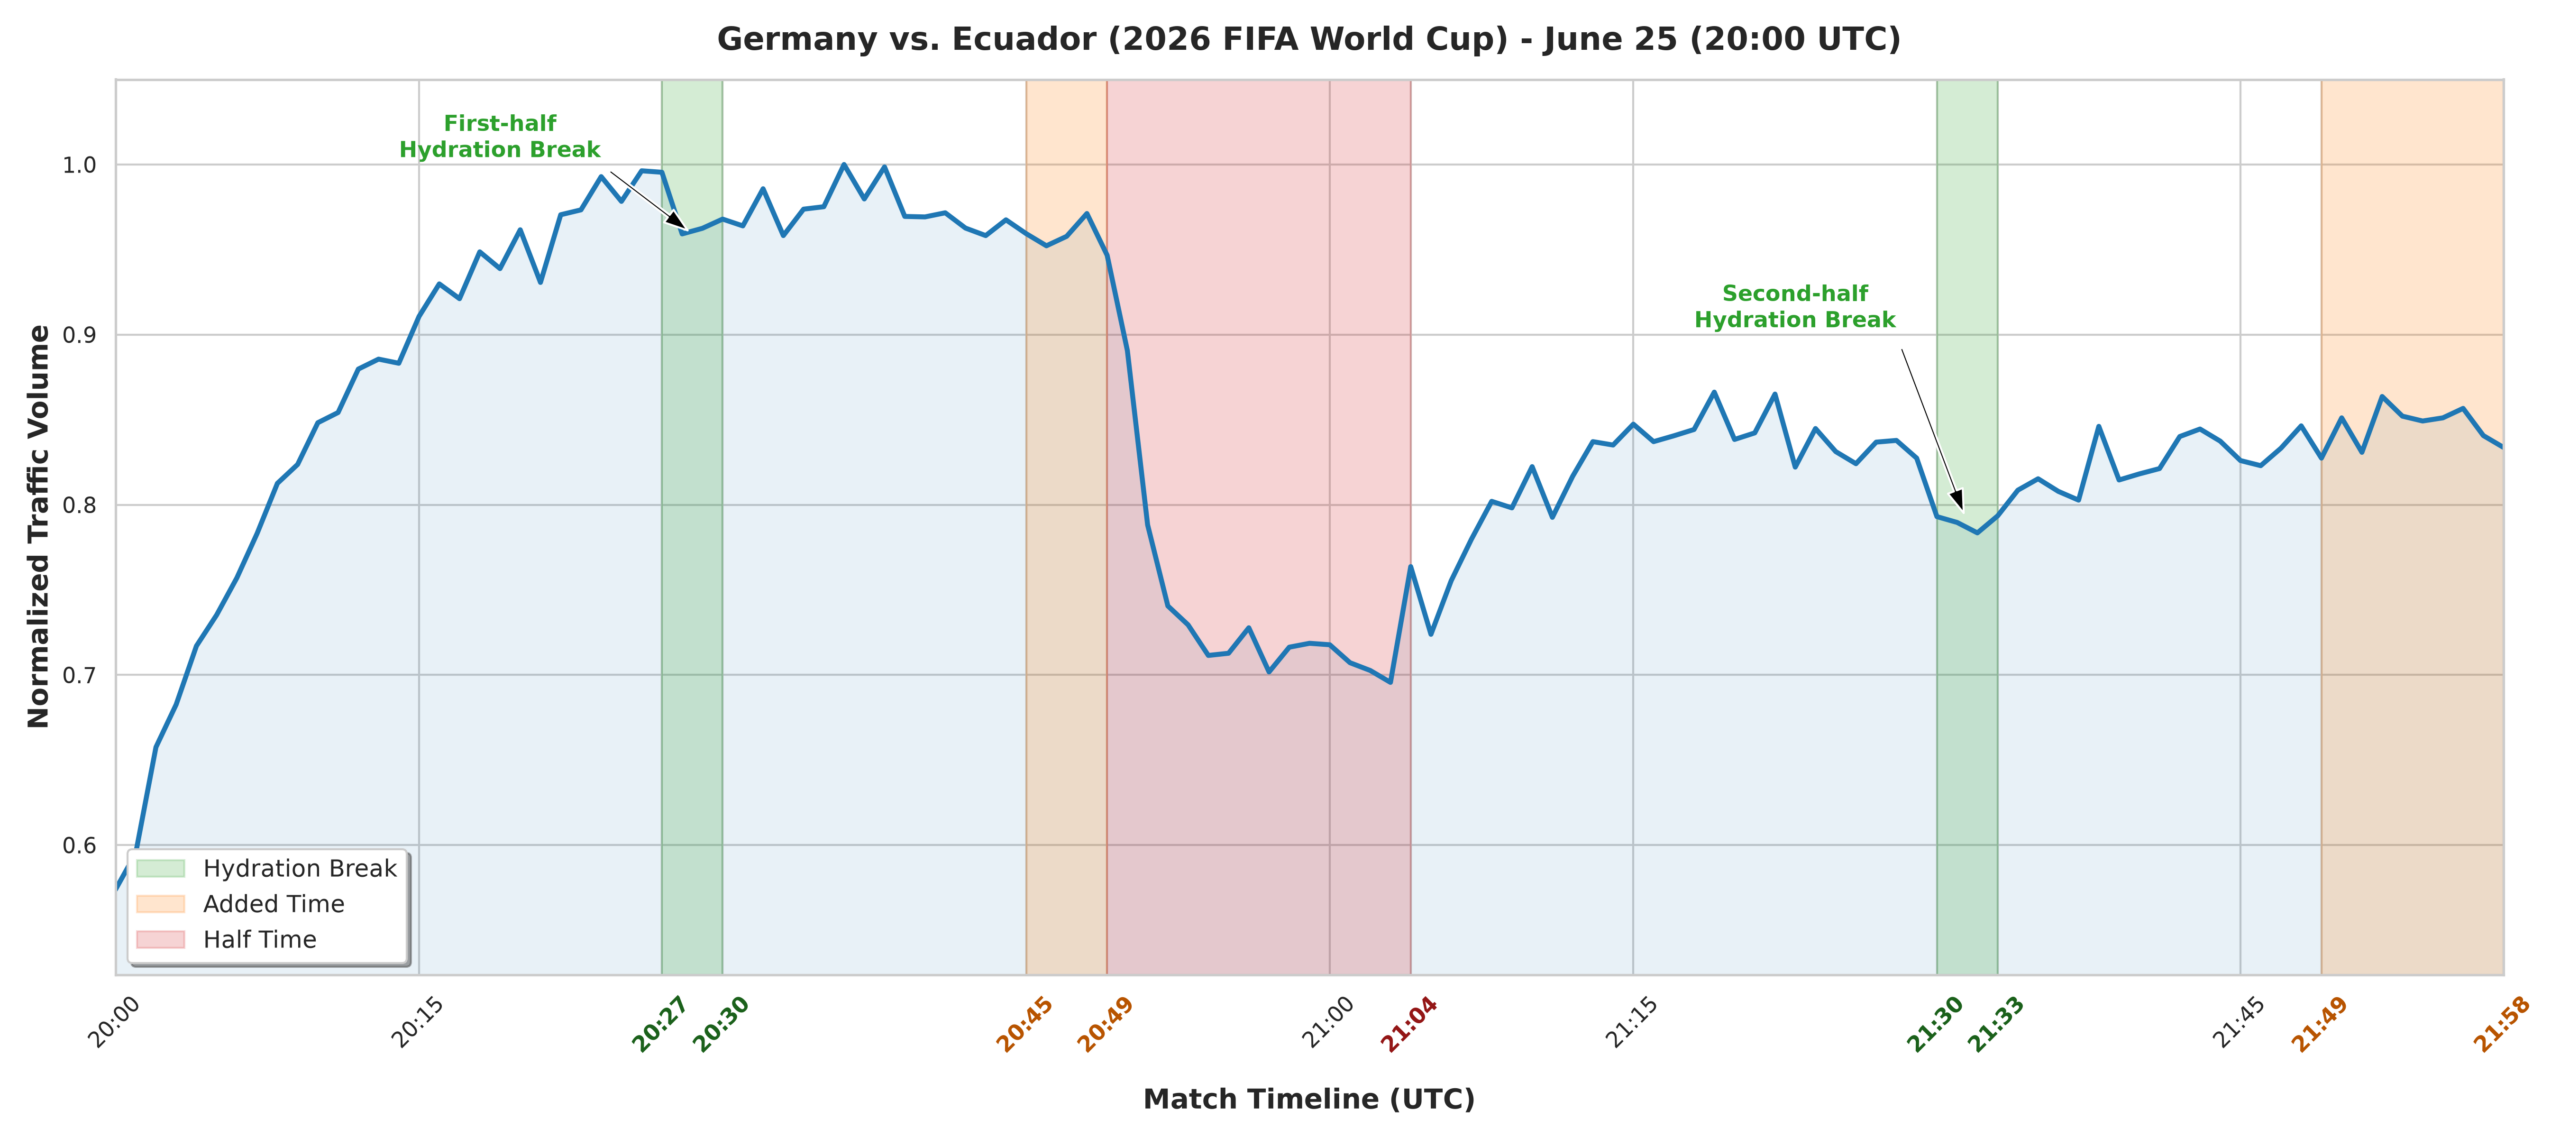
First, we used a dataset with a special one-minute timestamp granularity to analyze the match between Germany and Ecuador (Jun-25, 20:00 UTC) and determine exactly how game-state pauses translate into network fluctuations.
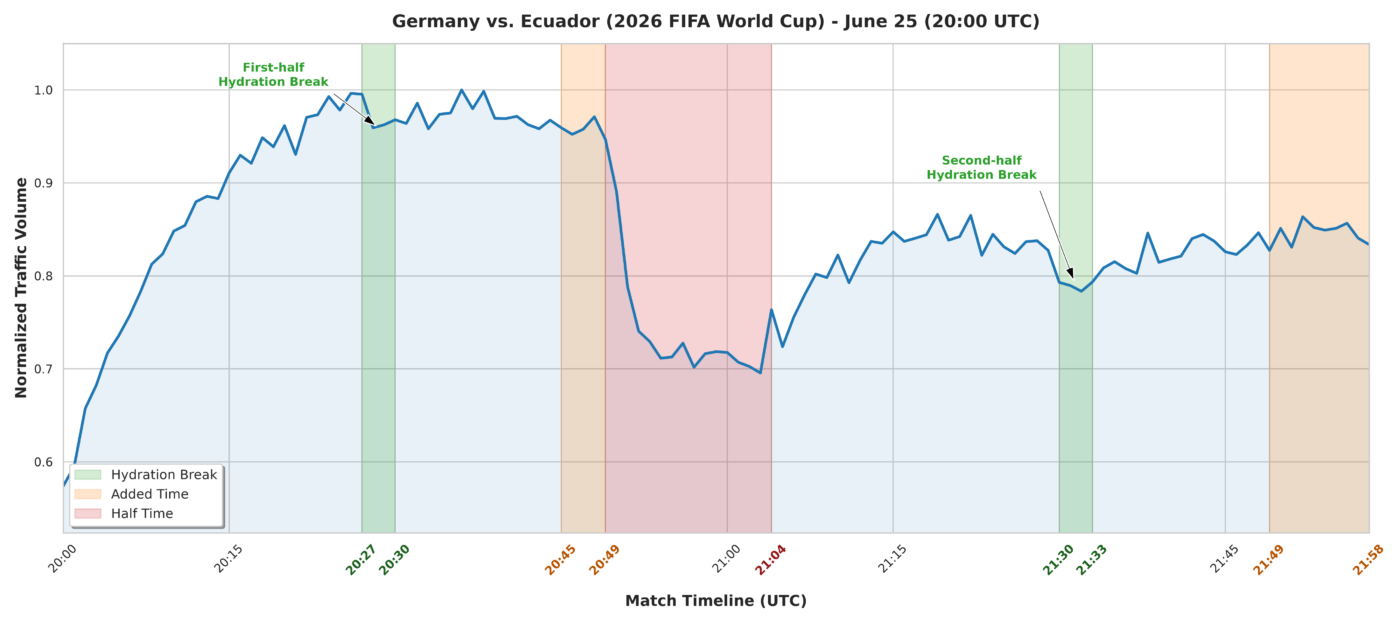
The new hydration breaks: We observed sharp, synchronized drops in traffic exactly during the newly introduced first- and second-half hydration breaks. When the referee blew those short pauses, viewers moved away from their screens, instantly reducing the load before it spiked again when play resumed.
Secondly, to observe the effects of prolonged games, we analyzed the knockout stage match between Colombia and Switzerland on July 07 (20:00 UTC). Using a five-minute timestamp granularity, a clear pattern of “fatigue and resurgence” emerges as the game exceeded the standard 90 minutes:
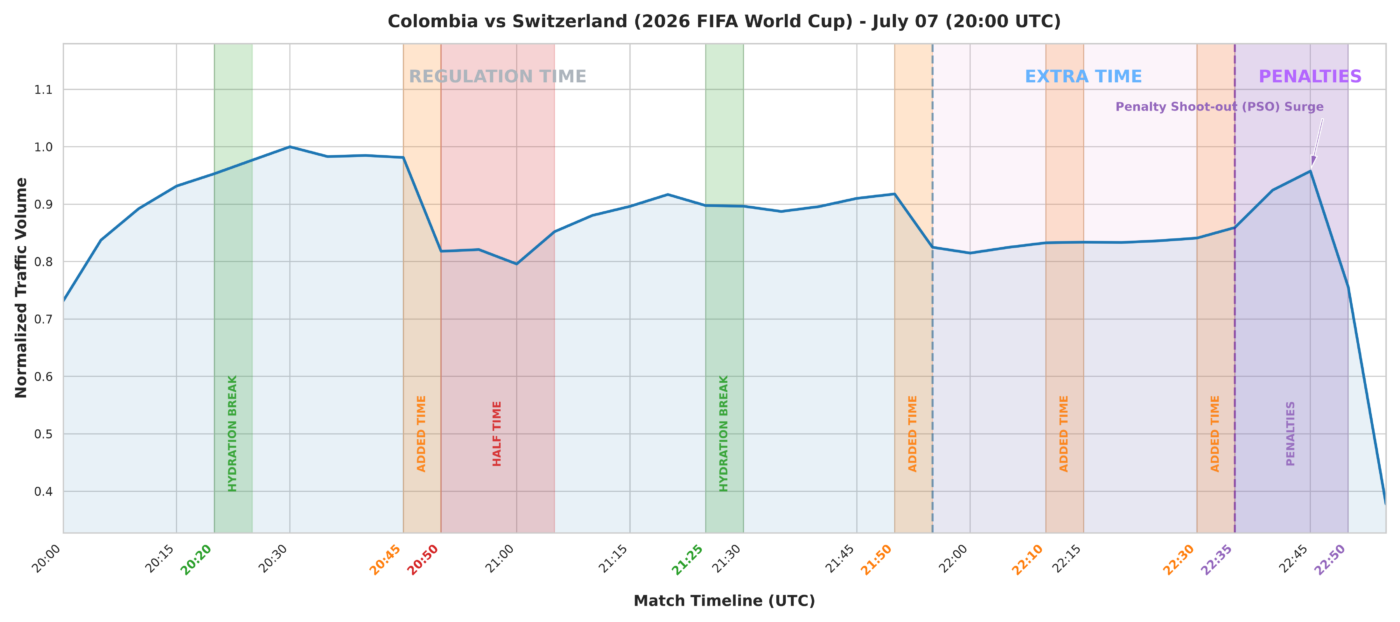
Audience fatigue (extra time): As the game entered extra time—late at night in Europe—telemetry showed a slight stabilization, followed by a decrease in viewer traffic. This perfectly illustrates the loss of audience as the night progressed.
The rise of penalty shootout: As the match went into the penalty shootout, the network experienced a sudden increase in activity within minutes. Fans who had stopped watching the game quickly returned to witness the decisive penalties.
Conclusion
The 2026 FIFA World Cup represented an extreme test for telecommunications networks, as their global infrastructure delivered this event to billions of viewers. In this context, as our detailed data analysis demonstrates, managing streaming events at this scale requires a new approach to monitoring and optimizing network traffic.
Using application-aware telemetry solutions like the BENOCS Application Identifier, network teams transform opaque data streams from different CDNs into helpful information. Matching official apps to their delivery routes enables network operators to improve local caching, negotiate specific private interconnections, and deliver a better Quality of Experience (QoE) for millions of concurrent users.