Right now Ingmar Poese is in Madrid soaking up the very interesting program (and possibly some sun) at MobiCom 2023. You can take a look at the program here: https://lnkd.in/ekXReVfK
MobiCom 2023
Right now Ingmar Poese is in Madrid soaking up the very interesting program (and possibly some sun) at MobiCom 2023. You can take a look at the program here: https://lnkd.in/ekXReVfK
Next week, from October 2-6, Hari Jayaraman will be in Fortaleza, Brazil, to attend LACNIC40. He’s looking forward to some interesting presentations, as well as finding out more about the wishes and needs of our Latin American and Caribbean customers!
Please reach out to us if you’d like to schedule a meeting with him and find out how you can optimize your network with BENOCS.
Summer break is over and we can’t wait to get to Prague next month for European Peeting Forum. The event is an absolute must for peering folks and we are thrilled to be a part of it. We are sponsoring the event, so please drop by our booth and let Stephan Schroeder, Hari Jayaraman or Péter György give you a demo of BENOCS Analytics!
It’s that’s time of year again: networking and sunset drinks beachside in Scheveningen, The Netherlands. Once again our friends from NL-ix are putting on the Late Summer Drink and we are happy to not only attend but also proud to be sponsors of the event. Looking forward to seeing some familiar faces and also new ones!
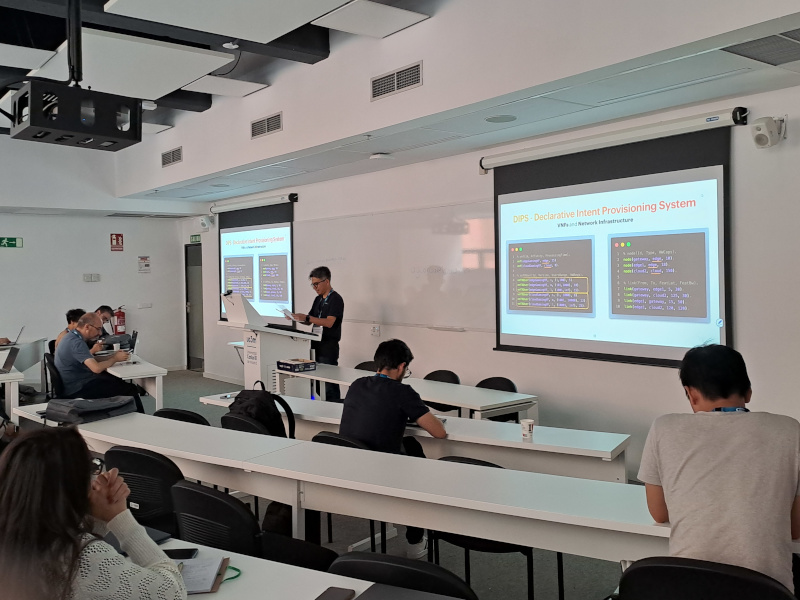
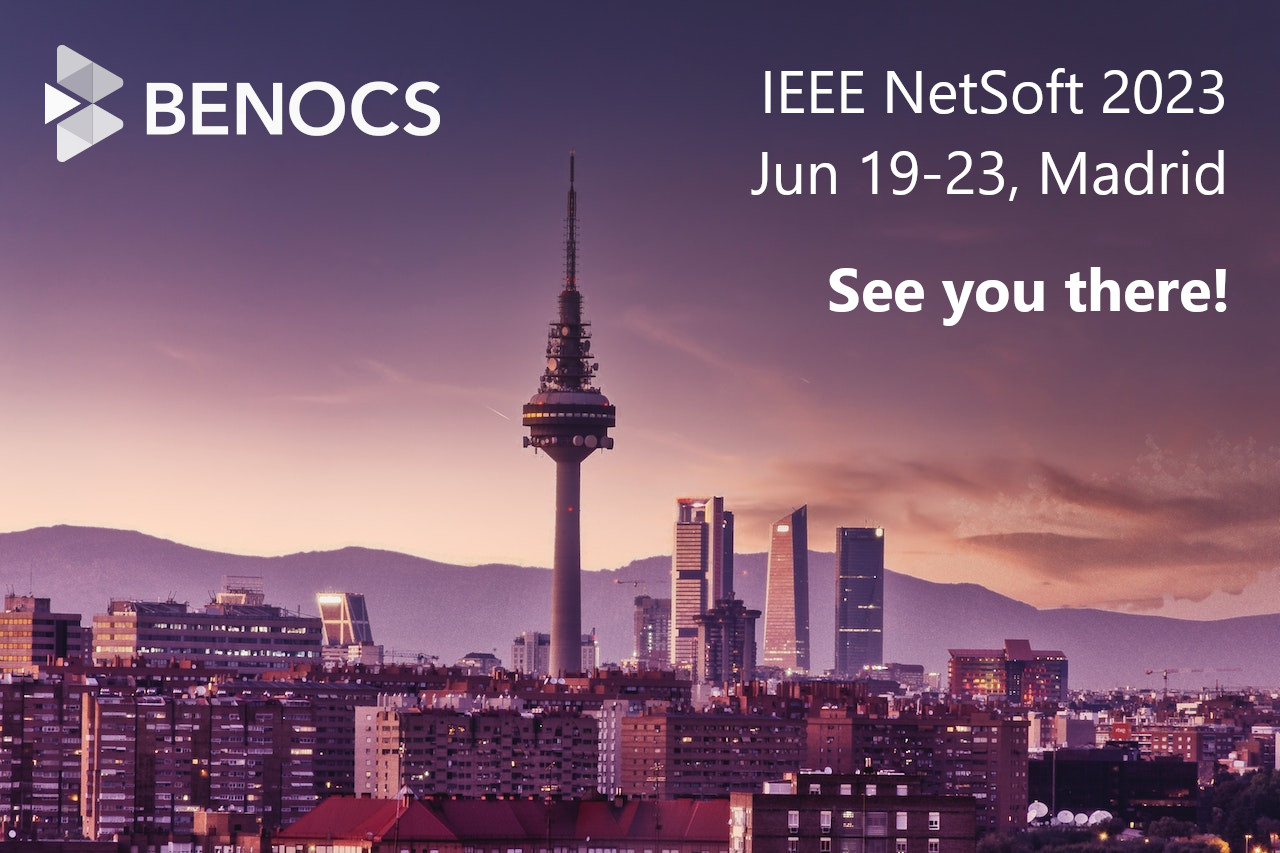
From June 19-23, BENOCS senior network engineer Danny A. Lachos Perez attended IEEE NetSoft 2023 and had this to say:
“The IEEE NetSoft is the flagship annual conference on Network Softwarization, and I had the opportunity to represent BENOCS at its 9th edition held in Madrid, Spain last week. I attended inspiring Keynote Talks, technical presentations, and demo sessions. I was also chairing the co-located Workshop on Intent-Based Networking (WIN’2023), with very interesting presentations and panel discussions regarding the interaction between network management systems and end-users. NetSoft also included an extensive social program that was used to (re-)start discussions for future collaboration activities with different industry and academic institutions, including Telefonica (Spain), Universidade Estadual de Campinas (Brazil), Nokia (France), and Universitas Mercatorum – University of Italian Chambers of Commerce (Italy).”
Exciting week coming up for our colleague Danny A. Lachos Perez. From Monday, Danny will be taking part in IEEE NetSoft 2023 in Madrid, Spain.
The event includes co-located workshops: BENOCS is industry track chair and also on the technical program committee of the Intent-Based Networking workshop (WIN’2023) on June 19. At the workshop, Danny will chair the Technical Session 2: IBN Prototyping Initiatives (https://lnkd.in/eJe3matb).
Really looking forward to what insights Danny brings back to Berlin with him!
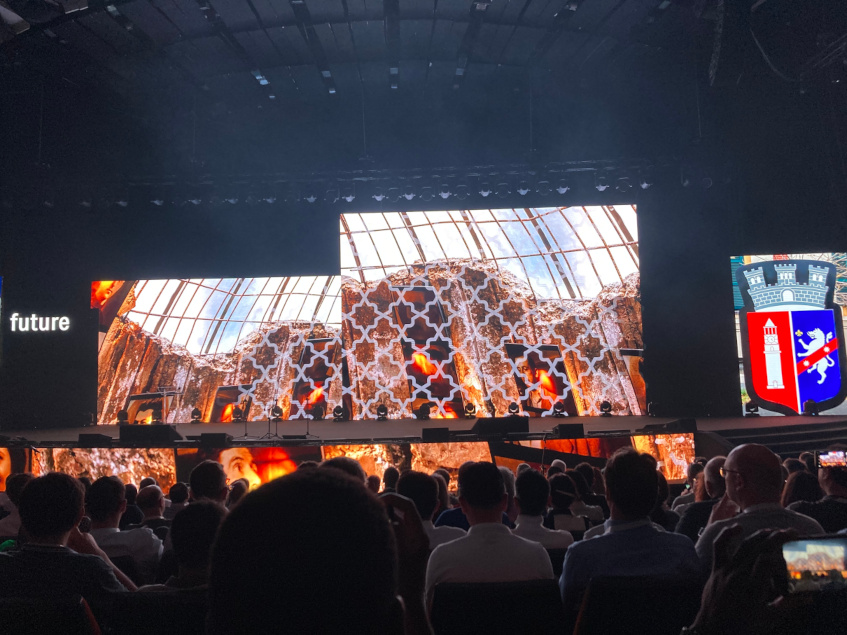
In the first week of June, Hari attended TNC23 in Albania, a first for us here at BENOCS:
“It was an eye-opening experience attending my first TNC in Tirana, Albania and listening to all the NRENs from different parts of the world such as GÉANT, NORDUnet, SUNET, CANARIE, UbuntuNet Alliance and many more. A common theme I noticed among all the NRENs is how passionate they are about working for the educational insitutions and the longevity of certain people in the industry, not to forget the openness of the community.
Special thanks to the organizers of this year’s TNC, RASH – Academic Network of Albania, who with their amazing hospitality and planning truly made this experience more memorable.
I’m certain the gathered insights will help us shape BENOCS Analytics in the right direction.
Looking forward to TNC’24 in Rennes!”
It’s time to celebrate! BENOCS turns 10 years old in June. We spoke to BENOCS CTO and co-founder Ingmar Poese to learn about the early days and his experiences since co-founding the company back in 2013.
Believe it or not, it was kind of an accident. At the time I was doing research at T-Labs for my PhD and they were looking for ideas for founding a company. Me & Oliver Holschke came with an idea for a business to serve large telco operators. He took care of the business side of things, while I did the technical stuff (I didn’t know much about business – and frankly. I’m still not really interested in that part).
The project was then in limbo for a year; we weren’t sure if it would take off at all. Then, in 2013, we got the go-ahead, and it was then that the company was founded conceptually. Back then the name ‘Berlin Networks Engineering’ (BNE), what we wanted to call the company, was already taken, so we couldn’t use it.
We wanted something with “Berlin” in the title, so we looked thought the available web domains for something that started with “BE”. We came across “BENOCS” and thought it sounded good.
The product was “invisible”; it simply looked cryptic and mathematical. It was originally an ISP-CDN collaboration tool and was active in the backend only. It was designed as completely transparent, not to be seen. Kind of like IP addresses: they exist and but generally no-one thinks about them, they just work.
However, there was one crucial issue: to get enough ISPs, you need a critical mass of CDNs, and vise versa. Today we still have this product and it’s called Flow Director. I still think it has huge potential in the market. Because it’s hard to see, though, it’s hard to sell.
Incidentally, BENOCS Flow Analytics was also an accident, which happened while we were developing Flow Director. So that’s something.
The first lesson I learned about the industry is also the biggest: telcos move slowly. It’s incredibly hard to convince them of new ideas, especially for a product as close to the core as ours, which makes it almost impossible to deploy in new networks. When it does work out, though, it’s extremely rewarding for both parties. I like working with large, complex systems, and you don’t get much larger than telcos.
Regarding business in general, I’ve learned one needs to be persistent. Because you can never make each and every customer 100% happy all the time, it’s often necessary to make compromises, finding the thing that works best for the majority. Then you can build out and develop the product further from there. This requires persistence and keeping your eye on the bigger goal.
Thirdly, I learned a few interesting things about going from academia into industry. Some see you “giving up” on research. Others decide you’ve not yet gained enough industry experience. You’re stuck between a rock and a hard place; it’s a tough place to be in. For me, research still the biggest inspiration for my work.
I’ve come to realize just how much I dislike bureaucracy. Having processes in place for the sake of processes sucks. I’ve learnt that not writing code is something I don’t enjoy and unfortunately, I do a lot more of it, i.e. not writing code, than I would prefer. I’m constantly learning soft skills: my people skills have come a long way, but I’m still working on them.
And I’ve learned that if don’t stop myself, I work too much.
I encourage healthy working hours. I try not to contact people outside of regular working hours, unless for work-related emergencies, I try to avoid too short deadlines. That said, I also expect everyone in my team to take responsibility for themselves. If you work too much or too little, you need to tell me, so we can sort it out.
As a company we generally want to keep our employees happy and healthy. After all, our team is the secret to making the best products for the telco industry: without them, we cease to exist.
Building our software would be a very different process today. The technology of 2023 is different; there are many tools now available that didn’t exist 10 years ago. As a result, some technical decisions could today be made differently.
I wouldn’t do much differently regarding the team itself and building up the business. A negative experience with someone in the team at the very beginning taught me that even if a position waits longer to be filled, that is better than hiring the wrong person to do the job. As I already mentioned: each member of our team plays an integral part in keeping BENOCS running smoothly and successfully. We are very conscious of whom we take on board and whether they are the right fit for the company. We are definitely doing something right: we have a fantastic team and I am grateful that they also chose us.
The next 10 years are going to be awesome.
While Hari is in Tirana taking part in TNC23, our colleague Péter György has taken a trip across town to attend the ETIS community gathering taking place today and tomorrow in Berlin. There he will talk about sustainability in telecoms and how, with BENOCS Analytics, you can save resources (and, well, money) in your network.
This week we are excited to be taking part in TNC23, hosted by RASH – Academic Network of Albania! Hari Jayaraman is this week in Tirana learning more about the NREN community and finding out how BENOCS can help them optimize their networks. Please come and say hi!
Big thanks to GÉANT for organizing the event!