The Streaming Explosion: A Network Telemetry Analysis of the 2018 and 2022 FIFA World Cups

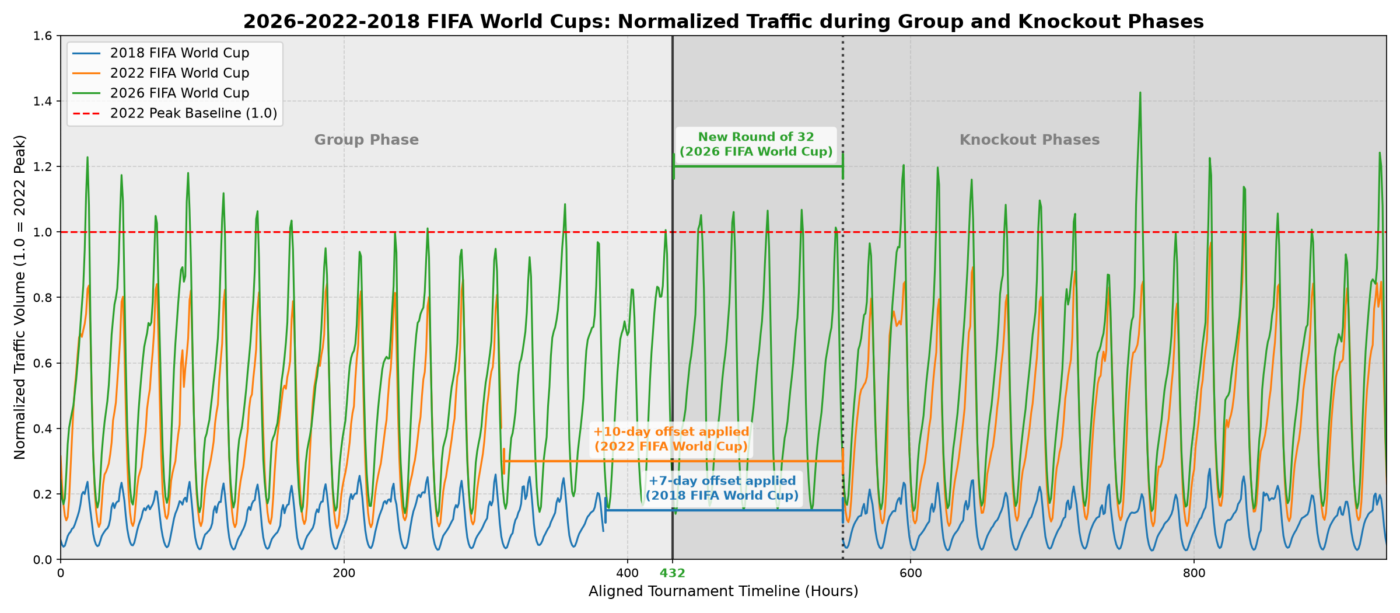
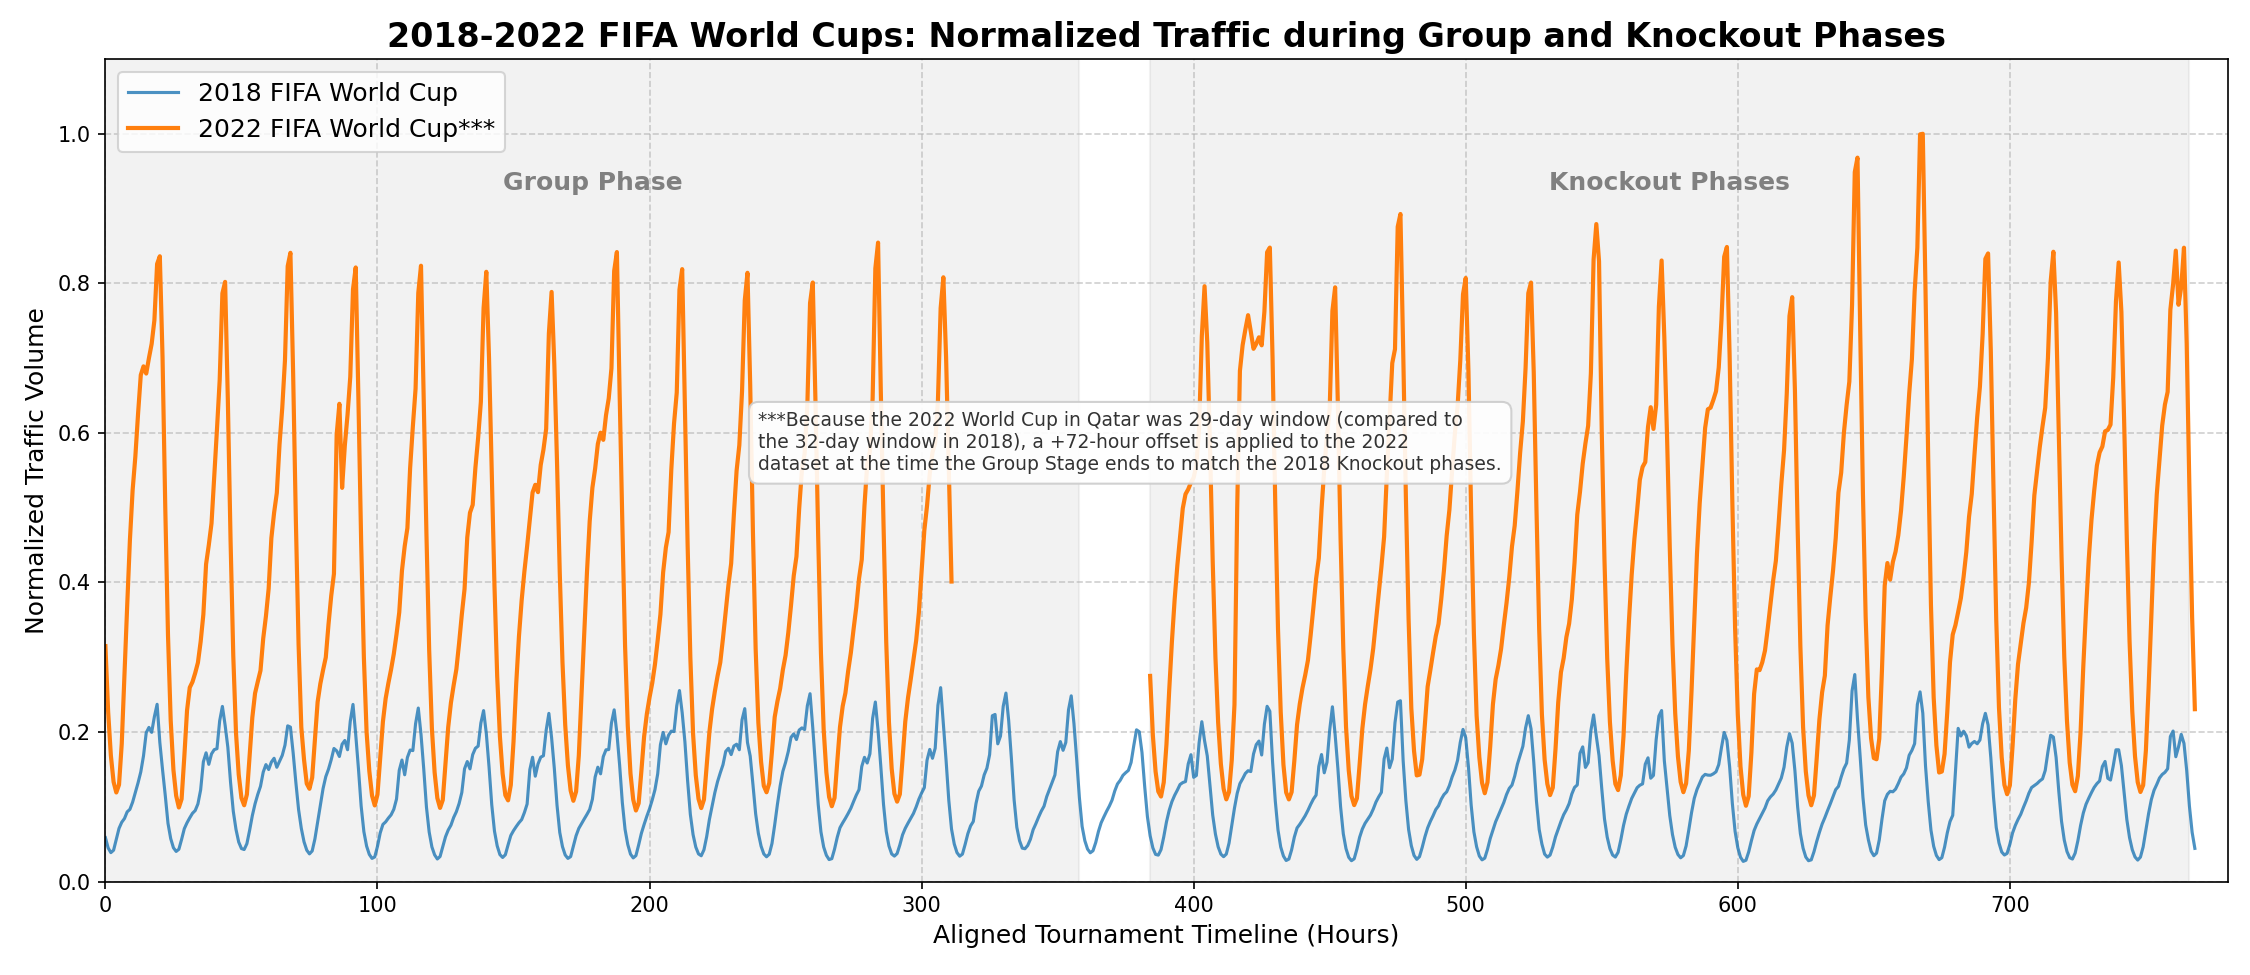
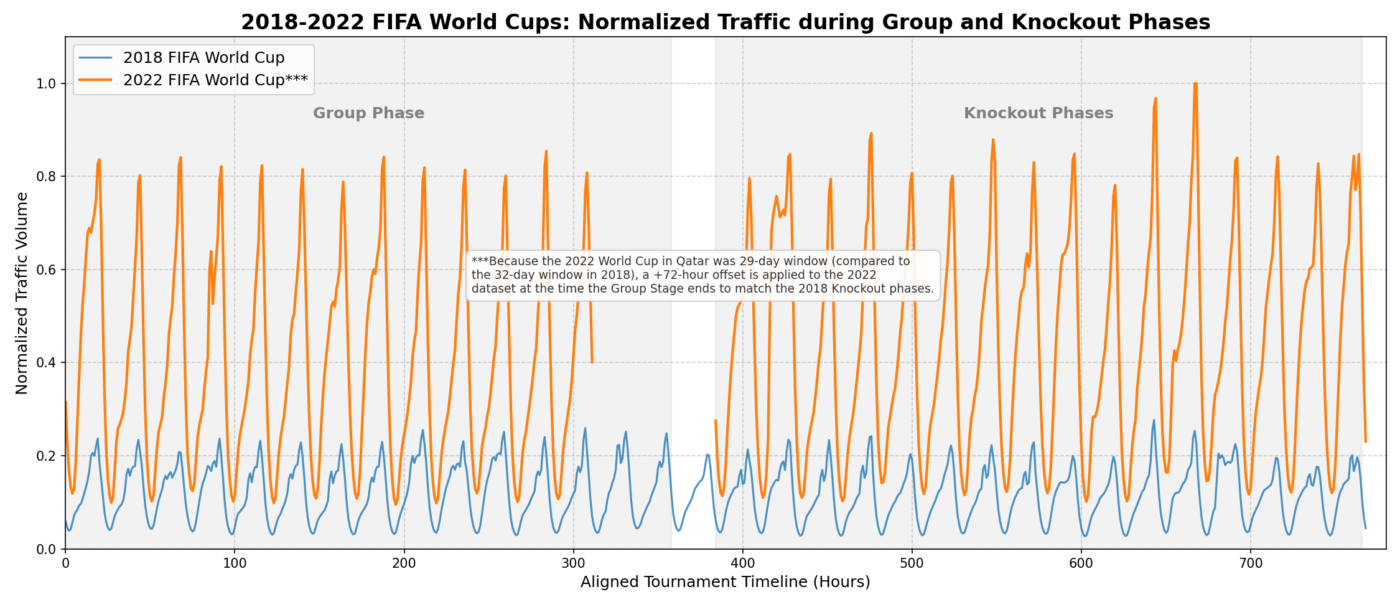
Normalized traffic volume during group and knockout phases of the 2018 and 2022 FIFA World Cups, over time.

With the 2026 FIFA World Cup kicking off today, ISPs and other telecommunication networks likely have some concerns as to how their network and infrastructure will react to the massive traffic demands. Live global sporting events like the World Cup represent an extreme test for even the largest backbone networks.

In this sense, historical telemetry data provides valuable insights on customer behavior; it enables a clear understanding of how quickly multimedia usage evolves; and it gives service providers the necessary analytical tools to predict and prevent congestion.

The following analysis explores the evolution of streaming traffic over two consecutive FIFA World Cups (Russia 2018 and Qatar 2022) at a large European ISP. We will illustrate the massive transition from traditional broadcast TV to Internet-first streaming, and discuss the multiple CDNs that are now used to keep the internet running smoothly during these massive live events.

(To maintain confidentiality, the telemetry data presented here has been normalized. All traffic volumes are scaled relative to the absolute maximum ingress peak observed during the 2022 tournament, which serves as our 1.0 baseline.)

The Paradigm Shift: 2018 vs. 2022

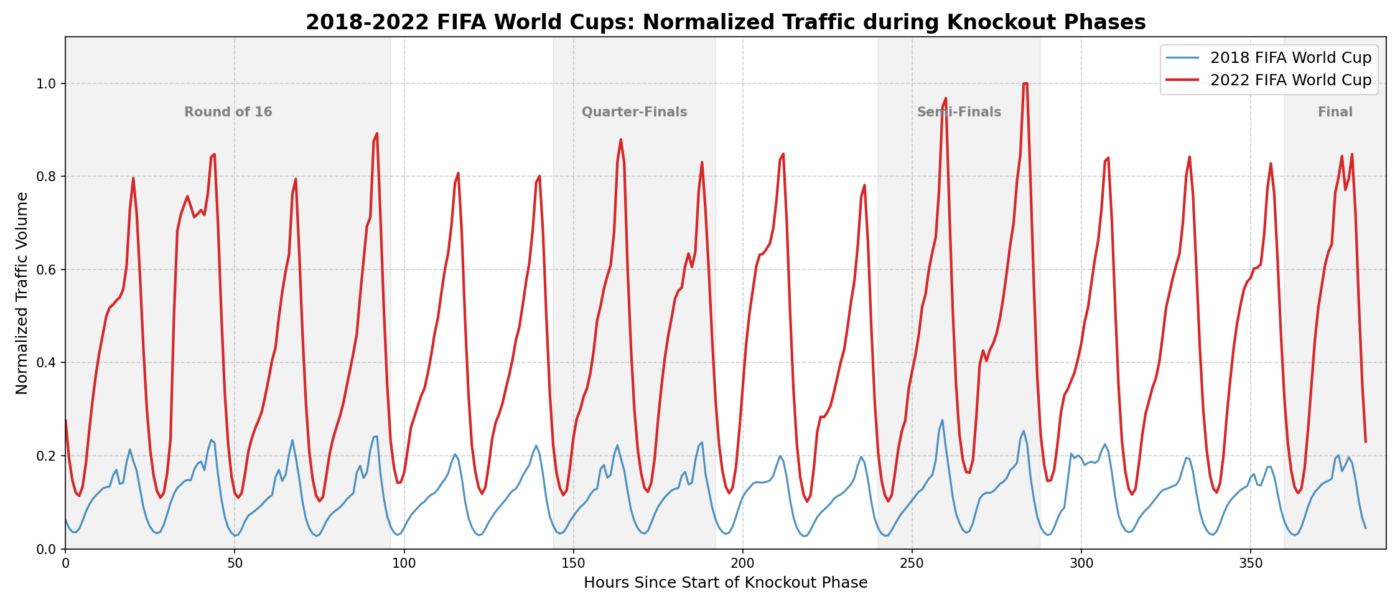
During the 2018 FIFA World Cup, the streaming landscape was strong but still behind linear television. Looking at the traffic distribution on the comparison figure below, the highest ingress traffic reached roughly 0.28 on our normalized scale.

Normalized traffic volume during group and knockout phases of the 2018 and 2022 FIFA World Cups, over time.
Figure 1: Group knockout phases

By the 2022 FIFA World Cup, viewer behavior changed completely as most people switched to a unicast OTT (Over-The-Top) streaming-first consumption model. This required networks to send millions of heavy/individual video streams at the exact same time instead of broadcasting one single signal to everyone. This behavior change caused peak streaming volume to grow by about 3.6 times, generating higher and longer peak demand periods, especially during the knockout phases.

Capturing and making sense of this magnitude of data requires a highly optimized backend. As we have explored in our discussions on BENOCS paired with your current network analytics for a high-performing network, a highly optimized data model is critical to make queries zippy, history accessible, the overview holistic, and hardware affordable. This is where overcoming today’s network visibility limits becomes crucial. By utilizing BENOCS fine-resolution retrospection on raw data, networks can easily detect historic patterns, apply predictive analytics, and manage these huge traffic spikes on the fly.

The Anatomy of a Knockout Spike

While the group phase involves weeks of continuous network traffic, the knockout stages represent the true stress test. As teams are eliminated and tension rises, casual viewers gather to witness the “all or nothing” moments. To visualize this escalation, we isolated the knockout phases of both FIFA World Cups and placed the round of 16, quarter-finals, semi-finals, and the final on a shared relative timeline.

Graph comparing normalized traffic volume during knockout phases of the 2018 and 2022 FIFA World Cups over time.

Looking at the overlapping timelines, some interesting network behavior patterns emerge:

  • The Climax Progression: Notice the steady upward trajectory. By the time the semi-finals arrive, each tournament hits its absolute maximum ingress peak: reaching 0.28 on our relative scale in 2018, and defining the 1.0 ceiling in 2022.
  • Semi-Finals are on Weekdays: Historically, World Cup semi-finals are played on Tuesday and Wednesday evenings. During the workweek, viewing is highly fragmented. People are finishing work, commuting, or watching on secondary devices like laptops and smartphones. This fragmented viewing is exactly why the semi-finals generate the peak traffic in both World Cups: millions of individual, heavy unicast video streams hit the ISP backbone simultaneously.
  • The Sunday Final Drop-off: Contrary to expectations, the highest streaming traffic does not occur during the final. World Cup finals are traditionally scheduled on Sunday afternoons or early evenings and often see people gathering in large groups at homes, pubs, or public viewing areas to watch the match on large screens. Those screens frequently default to traditional linear broadcast TV, which significantly reduces the load on the OTT streaming backbone.
  • The Scale of Change: If you look at the blue line, the traffic for the 2018 World Cup final did not even reach 0.25. Just four years later (Qatar 2022), the first day of the round of 16 generated more than three times as much data as that 2018 final.

Deconstructing the Peak: The Multi-CDN Architecture

When millions of viewers hit ‘play’ at the same time, the incoming traffic to an ISP network becomes a major engineering challenge. Surviving this level of traffic requires a smart, multi-layered delivery strategy.

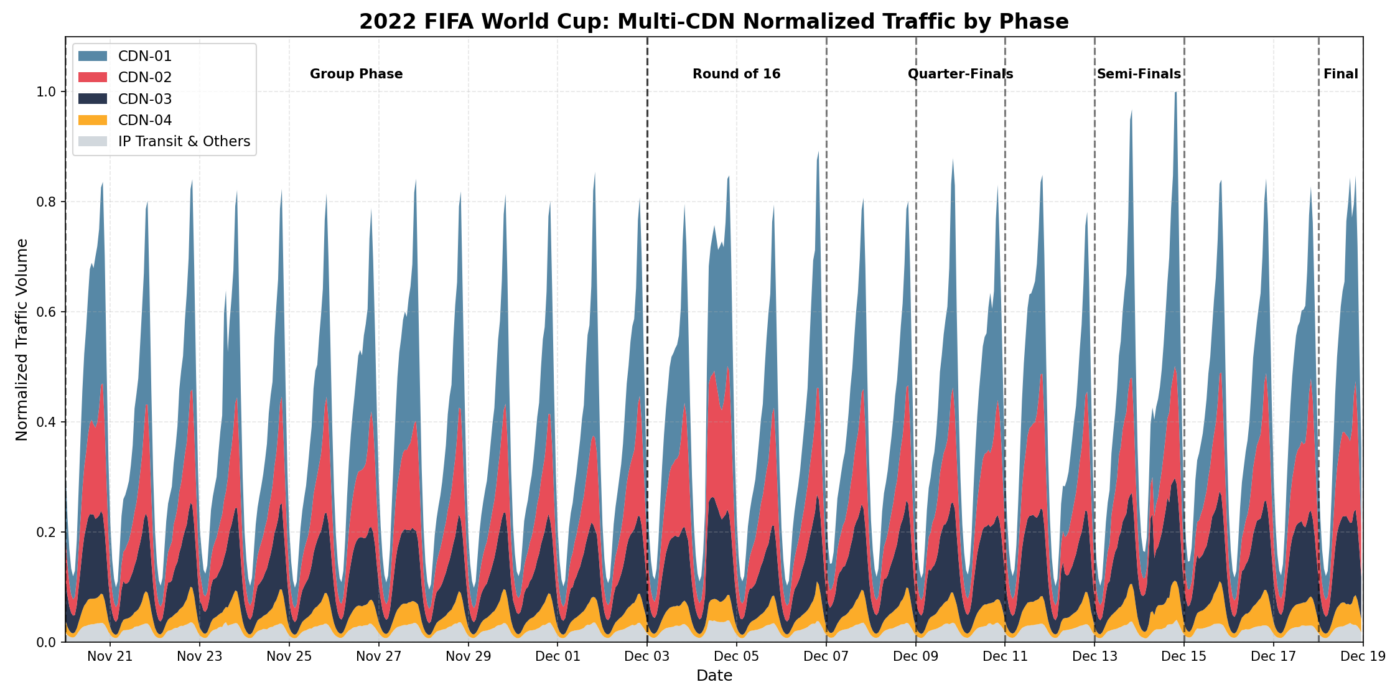
By analyzing the normalized ingress flow telemetry from the 2022 FIFA World Cup, we can examine how the traffic was balanced. To protect proprietary details, we have anonymized the primary public delivery networks into generic buckets (CDN-01 through CDN-04).

Graph depicting normalized traffic volume for multiple CDNs during the 2022 FIFA World Cup phases, from group stage to final.
Figure 3: Multi-CDN normalized traffic by phase

The stacked area chart shows that these huge traffic spikes are not coming from just one single network. Instead, they are supported by a carefully balanced ecosystem, where every level shows unique traffic behavior:

  • CDN-01 (top blue layer): This provider consistently handles the largest volume of traffic. It scales quickly to handle the brute force of millions of video streams, protecting deeper network links from crashing.
  • CDN-02 (red layer): This provider scales almost perfectly in sync with CDN-01. When CDN-01 fills up during major matches, traffic managers route the extra traffic through CDN-02 to keep things stable.
  • CDN-03 (black layer): This is the network that handles the “extra” work. Instead of just carrying the video feed, it is designed to also manage localized content, format optimization, and ad insertion.
  • CDN-04 (orange layer): Highly stable and consistent. It uses built-in network caching to deliver content directly to users, completely bypassing public internet congestion.
  • IP Transit & Others (gray layer): The base internet routing layer. It stays essential, but data shows that upper CDN layers successfully capture and handle almost all heavy traffic spikes.

Looking to 2026 FIFA World Cup: Extending Visibility to the Application Layer

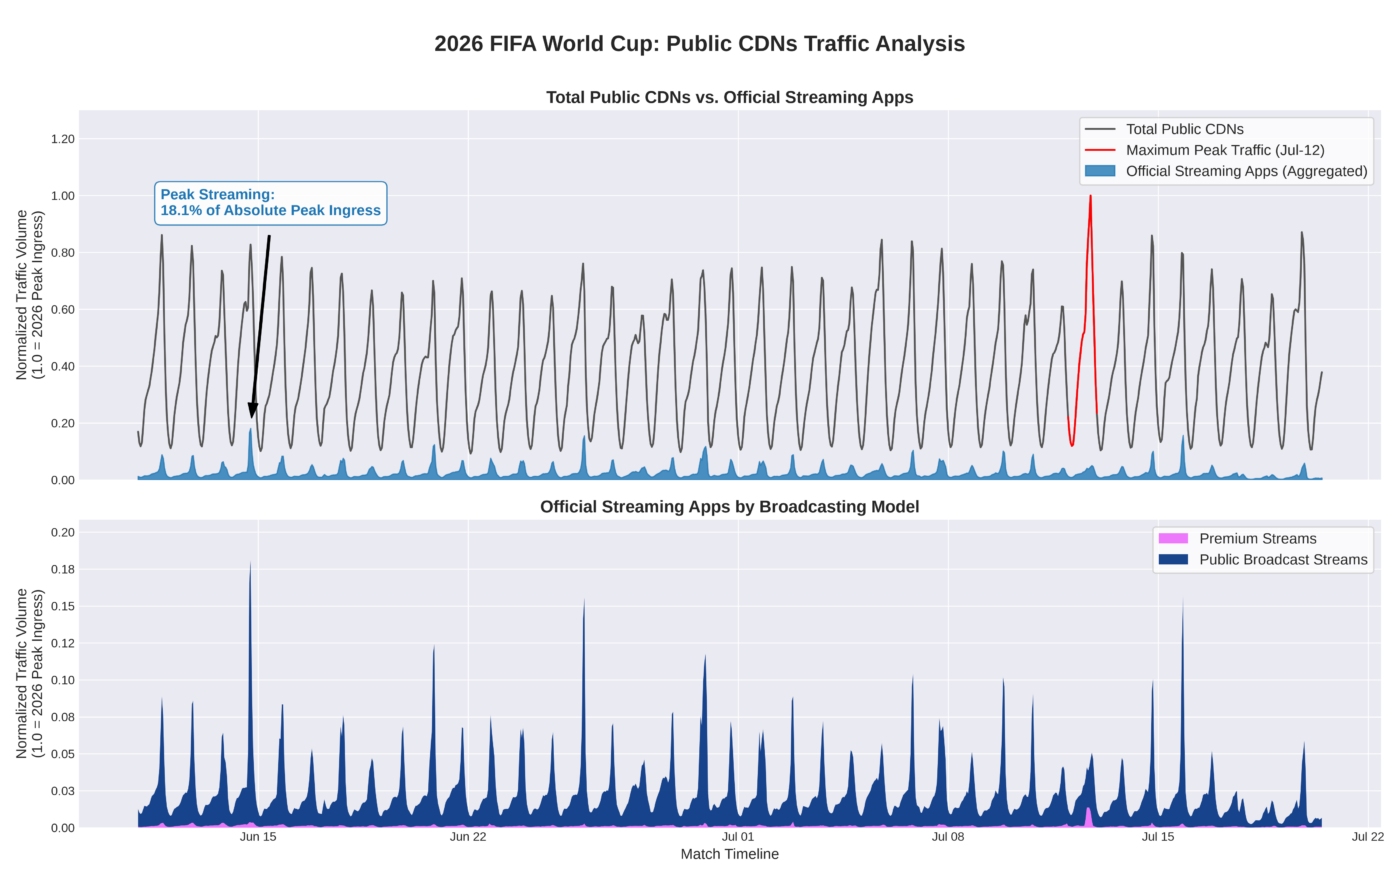
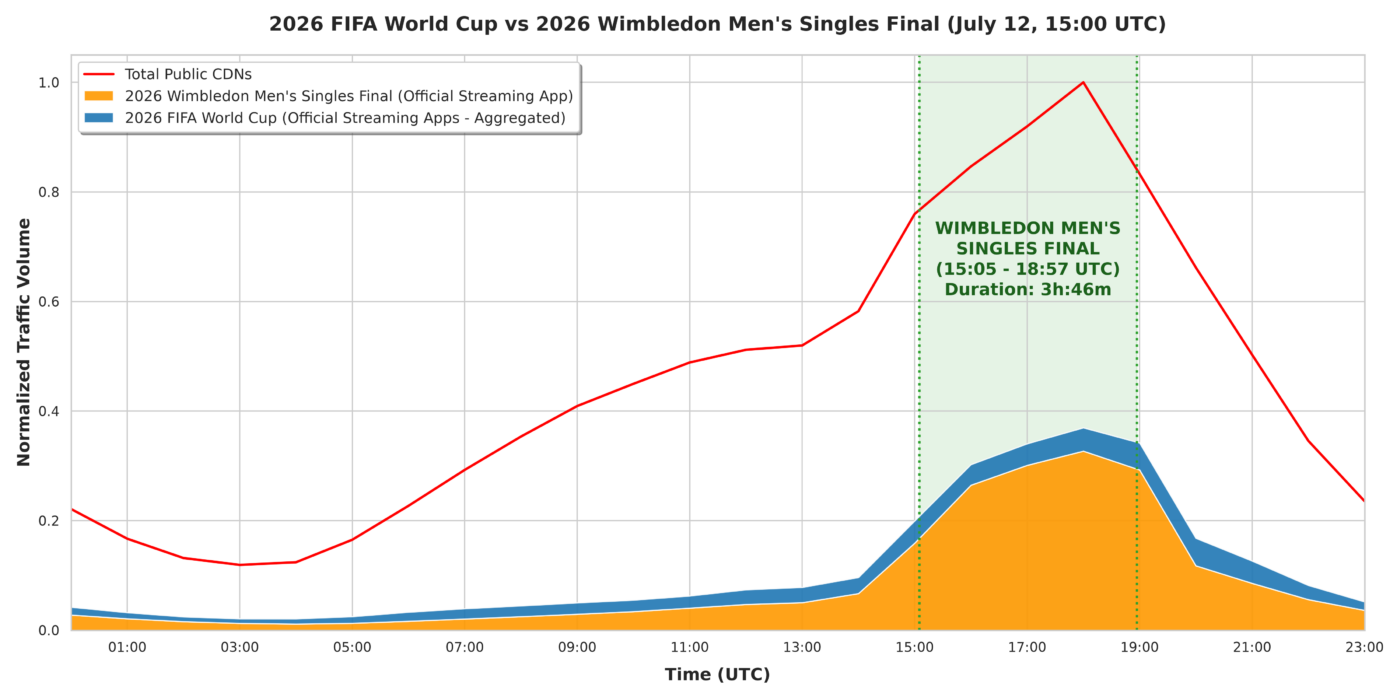
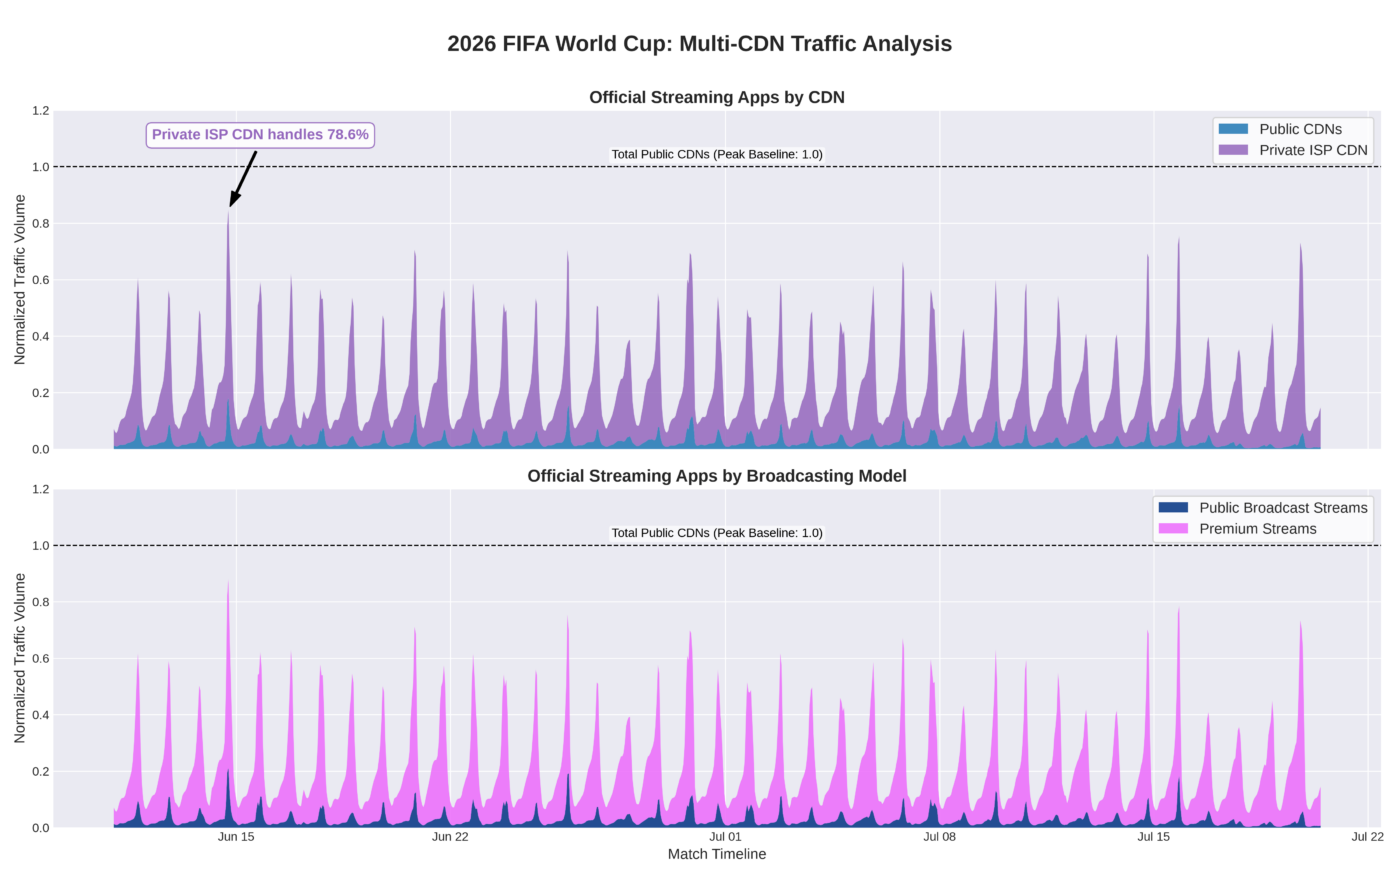
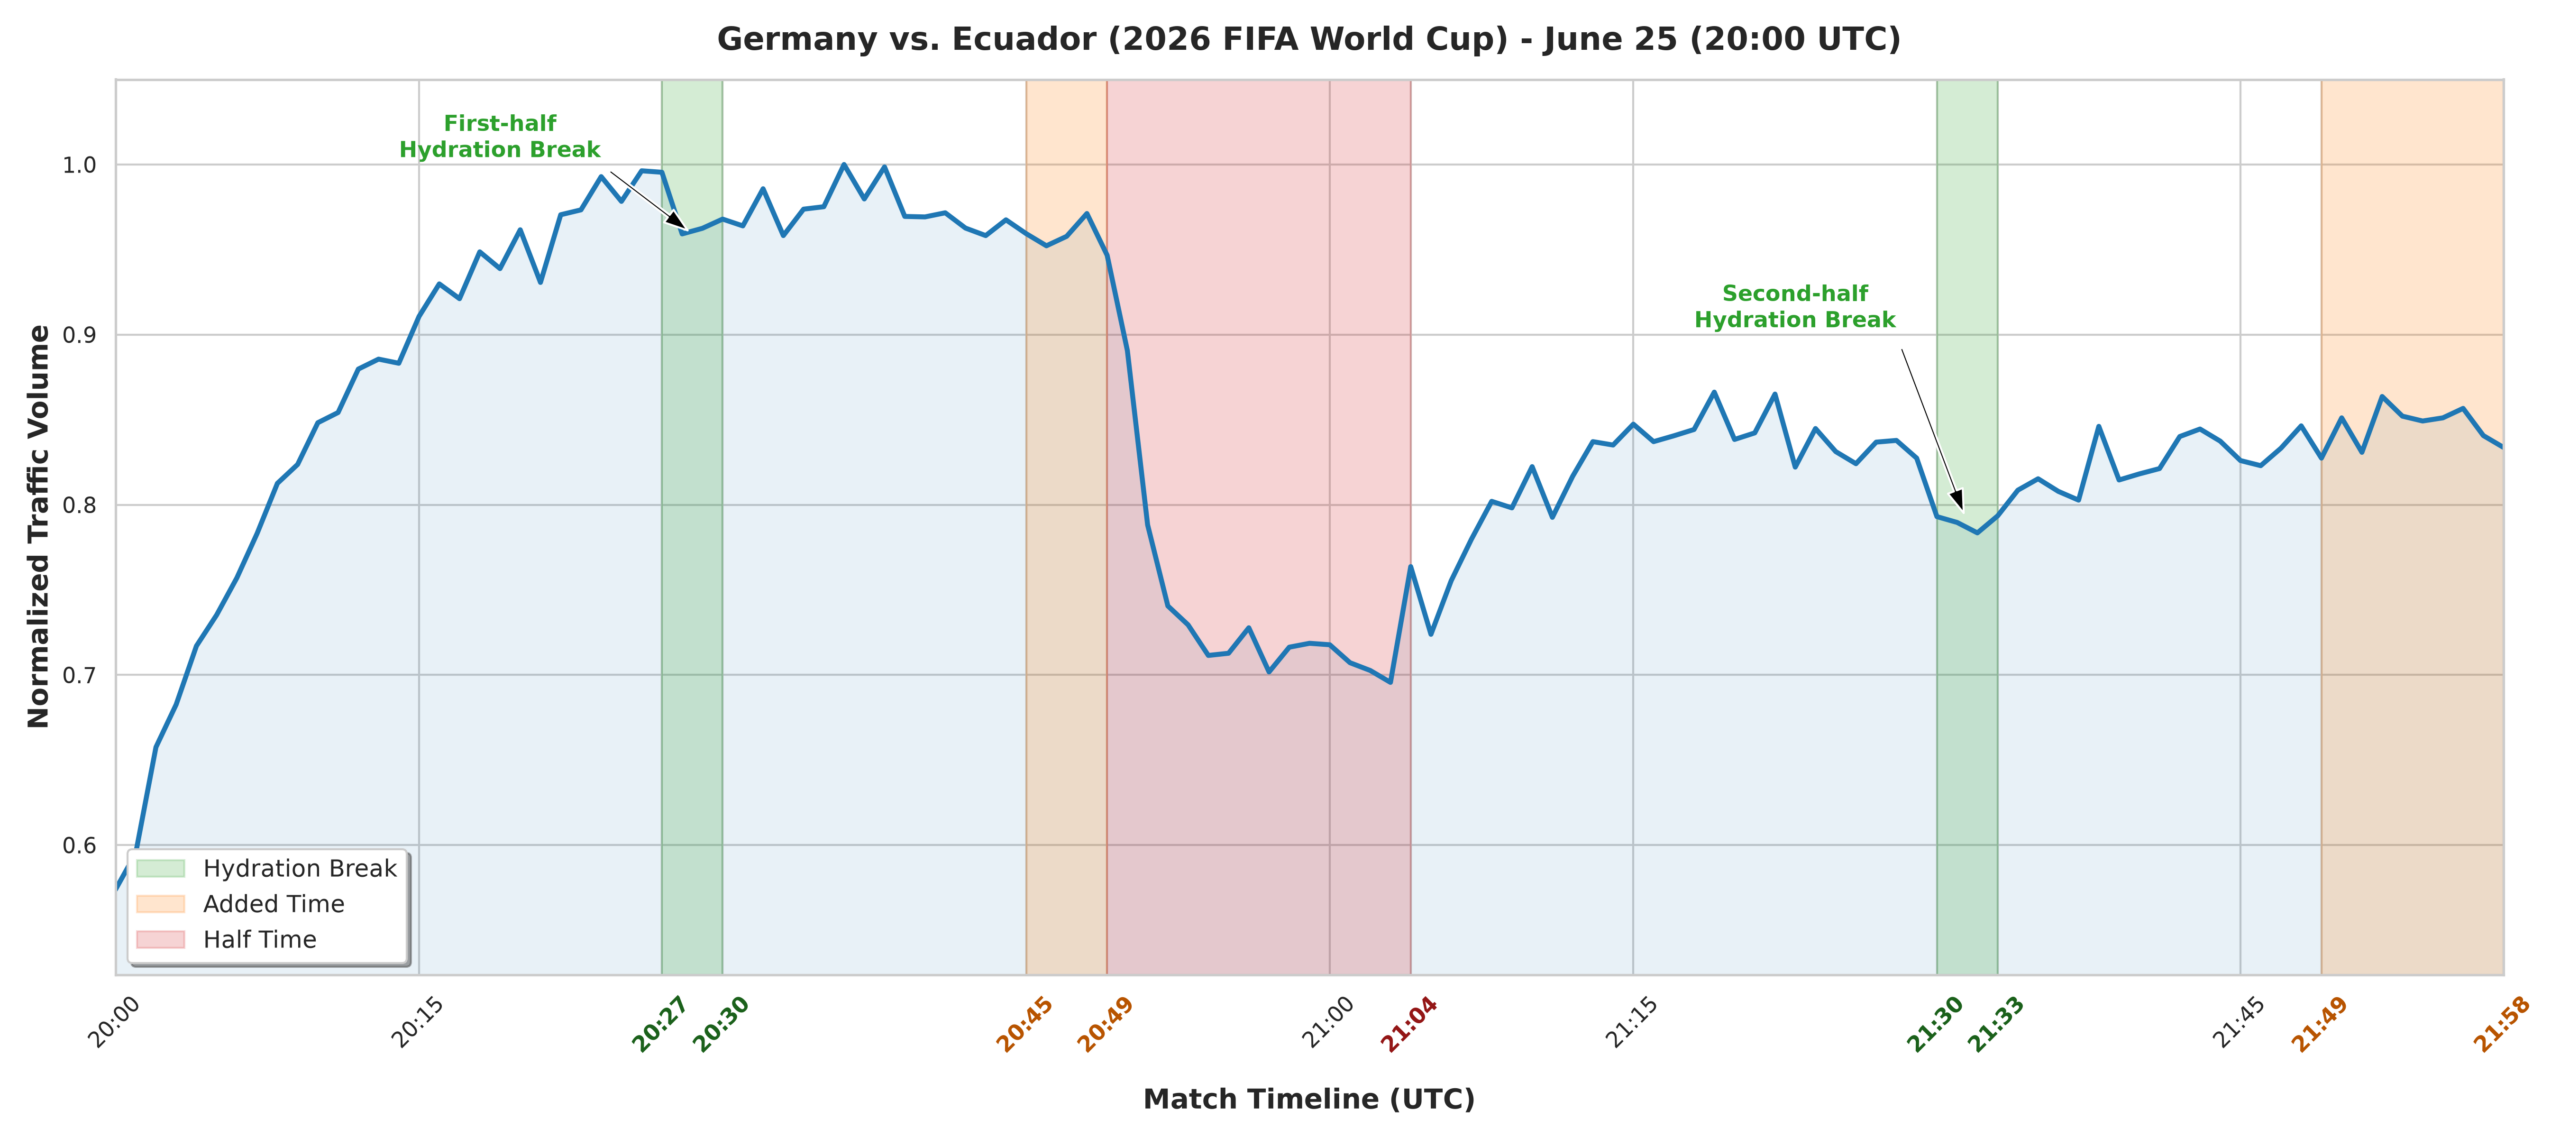
The significant time zone changes for the 2026 tournament, hosted by Mexico, Canada, and the United States, will require different capacity planning strategies, resulting in peak traffic occurring in the middle of the European night. Fortunately, by leveraging the BENOCS Application Identifier implemented a few years ago, we can now extend our traffic analysis beyond the transport level and directly into the Application layer.

Stay tuned for Part 2 of this series, where we will dive deeper into how this application-aware visibility is essential for effective troubleshooting, informed resource management, and a better understanding of the service-driven trends of major events like the current FIFA World Cup.

14. Networks Forum

Dresden skyline at sunset with the text "14. NETWORKS FORUM 11-12 JUNE, DRESDEN" and BENOCS logo.

On Thursday, 11 June, Péter Veréb-György will be in Dresden to present

Resilience by design: how BENOCS drives smarter, stronger networks

at 14. Networks Forum. 🙌

It’s shaping up to be an interesting event surrounding future-proofing of telecommunications networks.

TNC26

Helsinki skyline at dusk with the cathedral, promoting TNC 26 event from 8-12 June. At the bottom is the BENOCS logo.

On Monday, 8 June, Ingmar, Péter and Hari, will descend upon Helsinki in search of interesting and enriching discussions. They are really keen to learn how NRENs are tackling challenges in the current connectivity landscape.

And of course, they are also looking forward to catching up with our valued customers SURF and NORDUnet, and our partner GÉANT.

RISEx

Frankfurt skyline at night with illuminated skyscrapers, featuring event title "RISEx 28 May, Frankfurt" and the BENOCS logo.

In 2026, robust cybersecurity has become indispensable as AI-powered attacks, expanding cloud and IoT footprints, and increasingly sophisticated ransomware make protecting data, infrastructure, and digital trust a foundational requirement for businesses and individuals alike.

Tomorrow on 28 May, Stephan Schroeder will attend RISEx in Frankfurt am Main to discuss the most pressing topics with other analysts and practitioners in the sector.

MORE-IP 2026

Colorful canal houses line a waterfront in Amsterdam, with the text "MORE-IP 27-28 May, Amsterdam" and the BENOCS logo.

This week, Hari Jayaraman is on the road again, on his way to participate in MORE-IP 2026 in Amsterdam. Looking forward to meeting up with other members of the IP interconnection industry!

RIPE 92

Colorful buildings line a cobblestone street in Edinburgh, with text overlay: "RIPE 92, 18-22 May, Edinburgh.

It’s RIPE time!

Next week, from 18-22 May, Péter Veréb-György and Ingmar Poese will be in Bonnie Scotland to attend RIPE 92. Let us know if you’d like to arrange a meeting with either (or both) of them for a wee dram and a chat about the latest developments in internet networking.

Connectivity Insight Initiative

Purple dotted logo for the Connectivity Insight Initiative, featuring the text "Powered by Benocs and Inter.Link.

In the world of connectivity, visibility matters. Networks shift, routes change, and the effects often go unnoticed – until they don’t. That’s exactly the gap that the Connectivity Insight Initiative is setting out to close.

Inter.link and BENOCS are joining forces to publish free, practical insights about internet events, traffic patterns, and routing behaviour – all from a European perspective. The goal is simple: give the network community the intelligence it needs to make smarter networking decisions.

What does that look like in practice? Think topology changes that quietly reshape traffic flows, peering shifts between Tier 1 providers, and congestion events that degrade quality before anyone even notices. By combining Inter.link’s global IP infrastructure with BENOCS Analytics, these events become visible – and useful.

The initiative is about curating data and sharing it so the community can make better decisions. In today’s geopolitical climate, a Europen source of internet intelligence isn’t just useful; it’s essential for data sovereignty.

No paid subscription required. Just better insight for everyone.

Follow the Connectivity Insight Initiative on Substack to stay informed.

Peering Days 2026

Bologna skyline at sunset with towers, featuring "Peering Days 23-25 March" and "BENOCS" logo at the bottom.

For the first time ever, BENOCS is sponsoring Peering Days!

From 23-25 March, Sales & Strategy Manager Hari Jayaraman, Interconnection Product Specialist Péter György and BENOCS Co-Founder and CTO Ingmar Poese are excited to get into discussions about peering and network visibility within the European peering community.

Psssst! There might also be some interesting news they have to tell, so pop on over to the BENOCS booth to find out. Just in case.

Unlocking full network visibility

Red and black logo of Mobicom, featuring a stylized abstract shape and the brand name in lowercase letters.

How Mobicom discovered 50% hidden traffic with BENOCS Analytics

About Mobicom

Mobicom Networks is a group company of Mobicom Corporation and Mongolia’s pioneer and largest mobile network operator, serving over 1.7 million subscribers across one of the world’s least densely populated countries. Established in 1996 as a joint Mongolian Japanese venture, Mobicom has been part of the KDDI Corporation Group since 2016. With network coverage spanning 95% of Mongolia’s territory, Mobicom delivers comprehensive telecommunications services including cellular communications, international connectivity (IEPL, IPLC), IP wholesale, Transmission lease service and datacenter services. Mobicom Networks operates three international PoP routers located in Hong Kong, Frankfurt, and Tokyo, providing transit connectivity between Mongolia, Asia, and Europe.

Red and black logo of Mobicom, featuring a stylized abstract shape and the brand name in lowercase letters.

The Challenge: Operating with blind spots

Operating a nationwide mobile network in Mongolia presents unique challenges, but one critical issue that troubled Mobicom’s network was much closer to home, sitting right inside their own network infrastructure. Like many telecommunication operators, they deployed cache servers from throughout their network to deliver popular content directly to subscribers. These cache servers reduce bandwidth costs and improve user experience by serving content locally rather than through expensive international transit or private network interconnect (PNI) links.

However, their existing network monitoring solution had a significant blind spot. The respective solution is fundamentally built for security monitoring, specifically DDoS detection and mitigation. Because of this, it provides no visibility into traffic served by internal cache servers. These platforms focus on traffic entering and exiting the network at peering and transit points and generally do not collect NetFlow or IPFIX data from internal cache servers, since those servers sit inside the operator’s premises and don’t require the same level of DDoS scrutiny. The reasoning is sound from a security perspective, but this approach had unintended consequences for traffic engineering and business intelligence.

The impact was severe: Mobicom’s network operations team couldn’t see a substantial portion of their network traffic. They had no way to monitor cache performance, identify capacity constraints, understand subscriber behavior, or troubleshoot cache-related issues. Infrastructure investment decisions were being made based on incomplete data, and when subscribers reported streaming problems, the team had no visibility into whether cache servers were functioning properly.

Solution

What Mobicom needed was a solution built for comprehensive network intelligence, not just security monitoring. Enter BENOCS Analytics: Operational within Mobicom’s network since 2025, BENOCS now provides complete end-to-end network visibility, including the previously invisible cache infrastructure. The key differentiator is its ability to collect and analyze a multitude of protocols (Flow, BGP, SNMP, DNS and IGP) from the entire network, including cache servers within internal network infrastructure. It provides a fundamentally different approach to traffic analysis through its multi-dimensional Sankey visualization. The Sankey allows network operators to understand traffic flows across multiple dimensions simultaneously:

  • Source and destination ASNs, including content providers
  • Ingress and Egress routers and interfaces
  • Source and Destination subnets and IP-ports
  • Protocol and Service types
  • Applications and Services
50%
traffic visibility increase
2
caches added

Implementation

BENOCS worked with Mobicom’s team to configure all protocol exports (Flow, BGP and SNMP) from all critical network elements. The key to revealing cache traffic was understanding that content provider caches are deployed in different ways across operator networks, each requiring different identification methods.

Different types of cache deployments:

Caches with BGP Peering Sessions – Some content providers deploy caches that establish full BGP peering sessions with the operator’s network. These caches export BGP routes with their own AS numbers, making them automatically identifiable through standard BGP AS-Path analysis. BENOCS ingests the BGP data and identifies traffic from these caches based on the AS number in the routing table.

Caches without BGP Sessions – Many caches are deployed without establishing BGP sessions, as devices sitting inside the operator’s network. For these deployments, identification relies on interface naming conventions in SNMP descriptions. BENOCS can assign Pseudo-AS numbers based on agreed naming patterns (like “Akamai-Cache-01”) in the interface. This allows operators to track cache traffic even when caches don’t participate in BGP routing.

Private ASN Configuration – Some operators configure Private ASNs (AS64512-AS65534 range) within their own routing infrastructure to break out cache traffic, mobile gateways, or enterprise networks. These Private ASNs are learned automatically through BGP routing just like public ASNs, providing seamless identification without requiring pseudo-AS configuration.

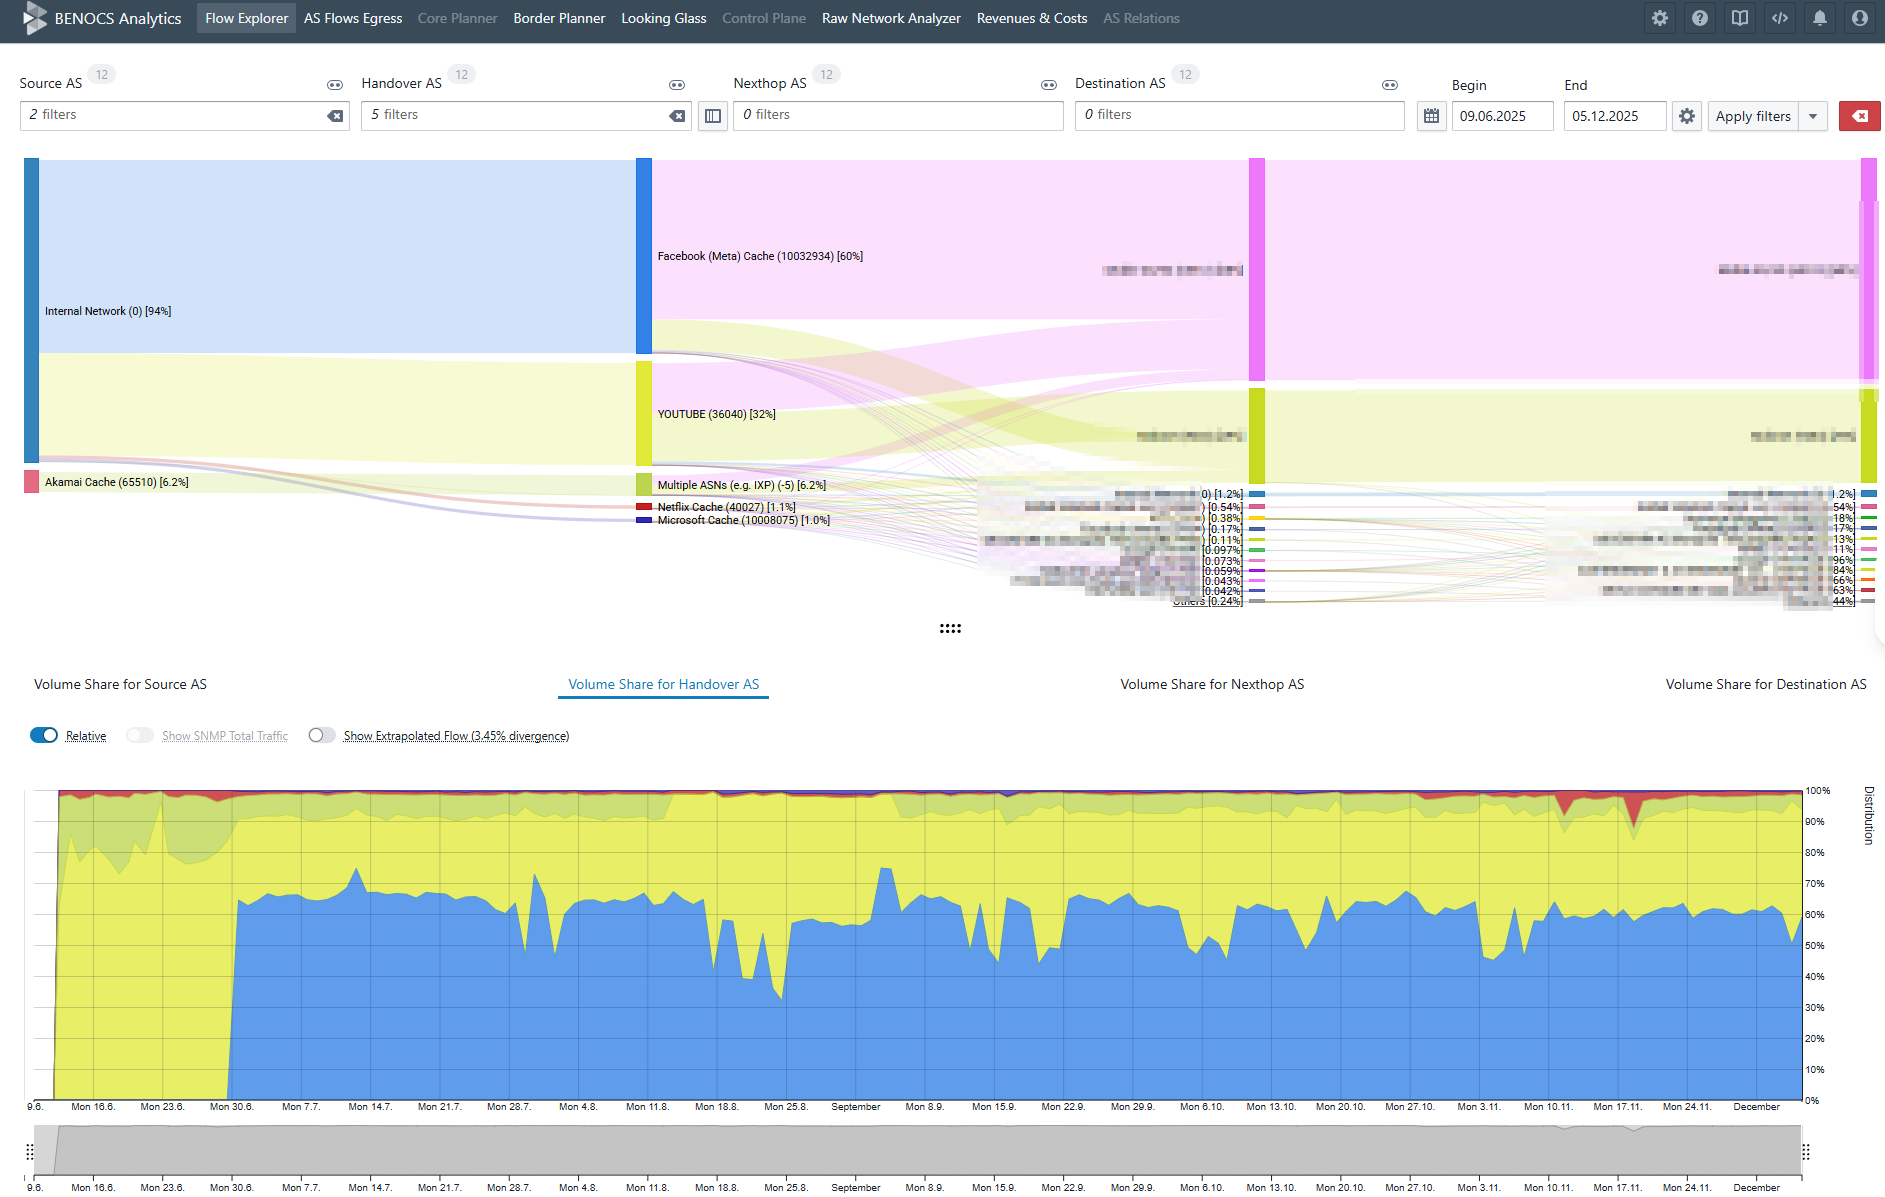
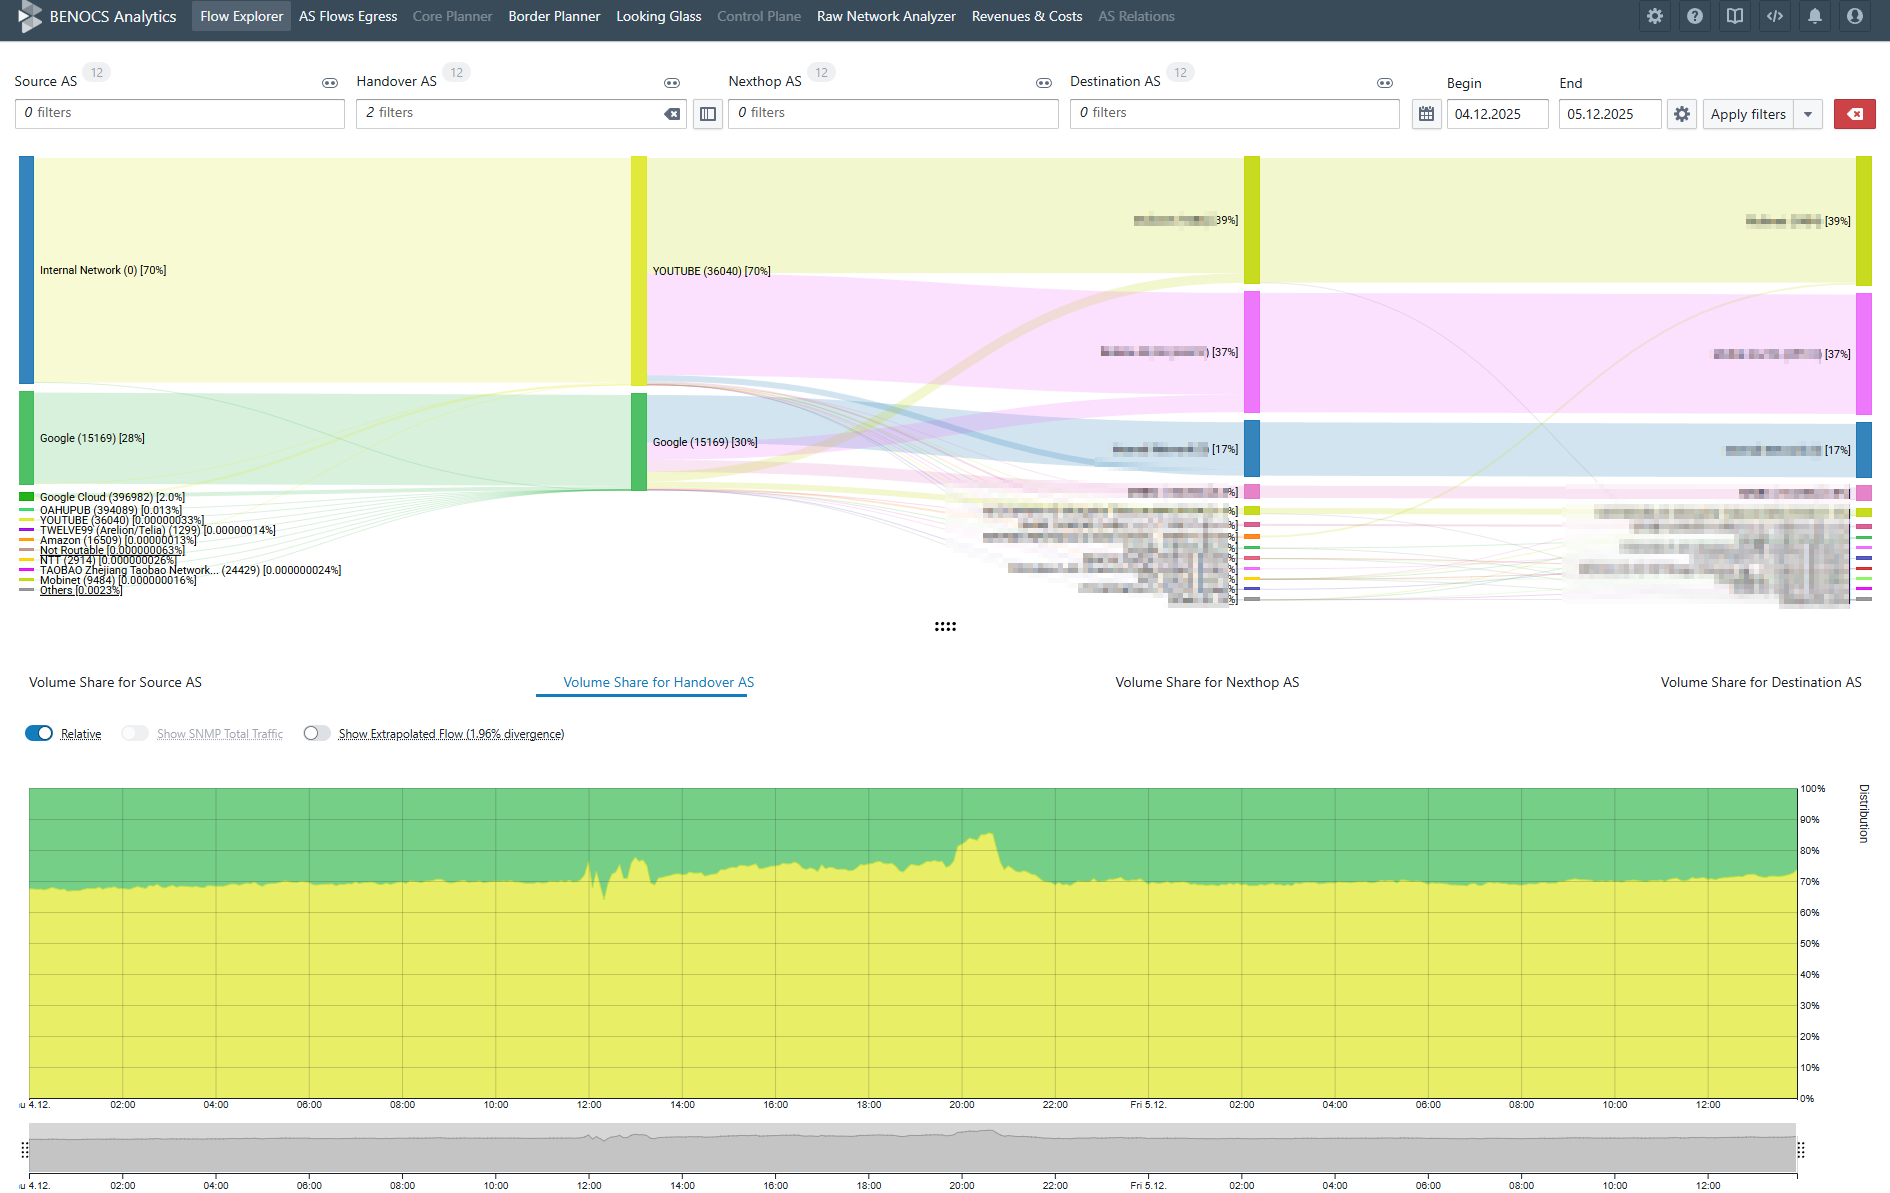
Network analysis visualization showing data flow and volume share across various caches.
All cache traffic (relative in %)

Through these identification methods, BENOCS Analytics successfully revealed cache infrastructure from Facebook within Mobicom’s network. Using BENOCS Analytics’ six-dimensional Sankey visualization, Mobicom could finally see traffic flows from all content provider caches through their network infrastructure to customer segments across different regions and time periods.

Results and benefits

When BENOCS Analytics became fully operational and cache visibility was enabled, comparing the three months before to three months after revealed a stunning discovery.

Network traffic volumes increased by 50% and by 70% during peak hours.

This wasn’t because subscribers suddenly consumed more data, but it was simply invisible in their previous monitoring solution. All this traffic flowing through Mobicom’s network had been completely hidden from operational view.

With complete visibility, Mobicom gained transformative insights:

  • Cache efficiency visibility: Analysis revealed an impressive 1:3 ratio between transit and cache traffic, i.e. for every 100G total traffic, 75G of traffic was served from local caches directly to subscribers. This demonstrated that 75% of content delivery was being handled locally, although some caches required cache-fill traffic of 25%, which lowers the total cache efficiency.
  • Proactive capacity management: The team could identify when cache infrastructure was approaching capacity limits and coordinate with content providers to address utilization bottlenecks. This prevented customer experience issues before they occurred.
  • Data-driven operations: Capacity planning and infrastructure decisions could now be based on complete traffic volumes rather than partial data. Lead time to resolution improved drastically when diagnosing performance issues.
  • Content provider collaboration: Mobicom was able to have data-driven conversations with Facebook about cache performance, traffic localization and capacity planning. These discussions were now supported by precise traffic measurements and utilization metrics.
Graphical representation of network data showing Google cache fill ratio and volume share metrics.
Google’s cache fill ratio (3:1)
After deploying BENOCS Analytics and adding all the caches, we discovered our traffic volumes grew by 50%. We had been operating with half our network traffic completely invisible. Facebook, Google and other content delivery caches were serving massive amounts of traffic without any visibility. The six-dimensional Sankey along with the time series revealed that cache servers were peaking at very high utilization during certain hours. More importantly, this visibility enabled us to identify high-usage content that wasn’t being cached locally. We requested and installed Valve and CDN77 caches based on this analysis, which significantly reduced our overseas traffic and resulted in substantial cost savings. Now we can monitor cache performance proactively, make informed capacity planning decisions, and work with content providers on optimization. This complete visibility has transformed our operations.
Headshot of a woman with long hair, wearing a dark top, smiling softly against a light background.
Bolortuya Erdenesuren
IP Planning Senior Engineer
Mobicom

Recent improvements

Building on this success, Mobicom is working with BENOCS to implement the Application Identifier module, which analyzes DNS cache misses from their DNS resolvers to identify specific applications delivered through all CDNs. This DNS-based correlation will enable Mobicom to see which CDNs are being used to deliver applications, like Disney+, TikTok, Amazon Prime etc. into their network, providing application-level intelligence that complements their existing network-level visibility.

Conclusion

Mobicom’s journey from having 50% of their network traffic invisible to achieving complete end-to-end visibility demonstrates a fundamental truth: you cannot effectively operate, troubleshoot or optimize infrastructure you cannot see.

With BENOCS Analytics’ intelligent cache identification methods and comprehensive network intelligence, Mobicom now has complete visibility of their network, enabling proactive management, accurate capacity planning, and better service delivery.

For telecommunications operators facing similar challenges surrounding incomplete network visibility, especially concerning content delivery infrastructure, Mobicom’s experience offers a clear lesson: security-focused monitoring tools excel at protecting network perimeters, but comprehensive network intelligence requires purpose-built solutions that reveal the complete picture of your network operations.

APRICOT 2026

Cityscape of Jakarta with modern skyscrapers, featuring the text "APRICOT 2026, 9-11 February, Jakarta" at the bottom.

Third time’s a charm!

For the third year in a row, Hari and Stephan, together with our partner Sean from MarvelTec Ltd, will be on site from 9-11 February in Jakarta. APRICOT has become one of our favourite conferences in the yearly calendar, and the guys are looking forward to good conversations around traffic visibility, network analytics, and the real-world challenges of operating and scaling networks at regional and global scale.

We also can’t wait to see our customers, partners and friends from the APAC region, whom we don’t get to see all that often!

If you’re attending APRICOT, come say hi. We’d love to chat about your network, your data, and what’s top of your priority list right now.