Work and network traffic after COVID-19

Video streaming traffic during COVID19

Like any of you, we here at BENOCS like to ponder current happenings around the globe. Whether it be the political state of affairs in various countries, the cost of public transport in a chosen city or the quality of service at the Vietnamese restaurant down the street: You name it – we‘ll debate about it. The SARS-CoV-2 pandemic, of course, is no exception. It is a topic that has fueled many a heated debate or two.

Doing what we do best (traffic intelligence as a service), we decided to take a closer look at the data to see how lockdowns have affected traffic during the SARS-CoV-2 pandemic and what this means for 2022 and beyond.

The Data

Looking at different network vantage points, what really stuck out was the surge in traffic coinciding with the first lockdown in the spring of 2020. This in itself was no surprise. What was surprising, however,  was – contrary to the expectations of the cynics amongst us – as countries went into lockdown, most of the working population was not sitting at home streaming videos. In fact, streaming services in some networks showed no increase in traffic that could not be attributed to seasonal changes and „organic“ growth.

What did happen when lockdown arrived was a major shift in the world of work and study. Suddenly, face-to-face communication was in many industries no longer possible; workers and students had to pick up the phone, use online chat, or engage with colleagues, customers, and teachers in video conferences. If you are one of the millions of former office-goers who was thrown suddenly into home office in March 2020, or a student who had to adjust to online classes overnight, you’ll no doubt recall recurring connection issues as your internet connection struggled to keep up with all your video calls.

Business Applications Traffic during COVID19

What is also interesting is the increase in traffic during periods of heavy SARS-CoV-2 cases. This suggests a fundamental, behavioral change in the way we work. Workers and their employers have discovered presence in the office is no more conducive to productivity than working from one’s sofa (which we do not recommend, by the way. Please be sure to work ergonomically correct!).

What does this mean for 2022 and beyond?

Will these levels of traffic remain? Our answer: Yes, partly. When comparing current traffic trends to those of previous years, we found no connection between the severity of lockdowns and the corresponding traffic. Traffic seemingly has plateaued to new levels with each wave.  This scenario, as already stated above, points to behavioral changes and suggests a “new normal” in how we work. Eventually the growth will slow, but it probably won’t return to pre-pandemic levels. We’ve come too far for that.

What do you think will happen to work and study traffic when the pandemic is over?

How can we prepare?

In increasingly complex networks, which are also at the mercy of outside influences such as the SARS-CoV-2 pandemic, network oversight has never been more important.

The scope of the SARS-CoV-2 pandemic was unprecedented: no-one can be blamed for struggling with the situation. Is it even possible to prepare for such an event? Perhaps not directly. However, it’s become obvious that not only is effective network oversight crucial but also the ability to act fast and targetedly in the event of increased network traffic. Having access to network analytics that deliver fast and reliable data is essential for customer and investor satisfaction. Remember my mentioning our BENOCS debate about the at the Vietnamese place earlier? Well, the service is great: Fast, reliable, and delicious (obviously). They really know how to keep their customers happy. Let us help you keep your customers happy too.

Mobile Telecom-Service LLP now backed by BENOCS Network Analytics

Tele2 logo

Berlin, Germany – Oct. 20, 2021 –  BENOCS GmbH stated today that they are now backing Mobile Telecom-Service LLP with their network analytics and intelligence. This high-performing tool gives Mobile Telecom-Service LLP the ability to monitor their traffic, trouble shoot network failures, optimize routing, seek new business opportunities and more.

Before installing BENOCS Analytics, Mobile Telecom-Service LLP was limited by their internal utilization tools. “The reason we decided to install BENOCS Analytics into our network is because we needed to see the top traffic originators in our network, and how traffic is distributed between different cities. “ stated on August 1st, 2021 from Mobile Telecom-Service LLP “BENOCS analytics gives us that visibility. Additionally, the BENOCS team made installation easy.”

As one of the largest telecoms in Kazakhstan, “we believe our analytics tool can make real change in the way with Mobile Telecom-Service LLP plans, routes and analyzes their network traffic.” Stated BENOCS CEO, Stephan Schroeder. “We are very glad to have Mobile Telecom-Service LLP’s trust to provide them with the best possible network intelligence.”

ABOUT BENOCS

BENOCS GmbH ­ – a spin-off of Deutsche Telekom – is a small company with big plans to revolutionize the way network traffic is managed. Their intelligent and fully automated solutions fit networks of any size and provide ISPs as well as CDNs strategic ways of coping with growing network traffic. With BENOCS Analytics, network operators, transit and wholesales carriers, Hosting and CDNs gain end-to-end visibility of their entire traffic flows.

ABOUT Mobile Telecom-Service LLP

Mobile Telecom-Service LLP is one of the fastest growing telecom operators in Kazakhstan. Founded in 2016 with the launch of their GSM network, Mobile Telecom-Service LLP has gone from a small regional operator to a state-level player.

Mobile Telecom-Service LLP ended 2020 as a winner in the Fastest Mobile Internet Speed, Best Coverage and Best Mobile Network nominations in Kazakhstan. In the first half of 2021, the operator confirmed its high positions, again winning the above nominations according to the Speedtest® service from Ookla TM.

For more information: https://kursiv.kz/news/hi-tech/2021-07/luchshiy-mobilnyy-internet-po-prezhnemu-u-tele2

Heatmaps are the best way to view your external links’ behavior

Screenshot BENOCS Border Planner (formerly known as "External Links") screenshot

Network traffic is growing every day. We’ve known this for years, however the Internet events revolving around COVID-19 lock-downs showed us how dramatically it can grow over a short period of time. That is why BENOCS created the External Links Heatmap for Capacity Planning.

If you were following the news in spring 2020, you might remember Netflix announcing a reduction in stream quality for 30 days to ease the strain of video traffic on ISPs. So why did this happen? Well, the new (at the time) lock-down regulations turned the world as we knew it upside down with the Internet bearing the load. The once face-to-face contact activities such as work, socializing, education and entertainment, went virtual, which led to an unprecedented strain on the network. How?, you may wonder. For one thing, image content, specifically video, is very heavy, which creates a lot of traffic. Additionally, more users went online at the same time, clogging the Internet pipes and straining any through traffic . As a popular video streaming company, you, too would probably conclude that reducing network traffic was better than cutting off customers.

So, what does this anecdote have to do with BENOCS’ capacity planning? Well, as you can imagine, operators were overwhelmed by those surges in Internet traffic. Additionally, the tools they used to monitor the traffic, specifically external links, were too slow and complex to solve the issues fast enough. How could they know the very basics of their network’s performance? Who was filling their pipes? Where could they logically add more capacity?

What we mean by external links

As someone living in the era of the Internet, you are probably most familiar with the term “link” as an abbreviation for “hyperlink” or website address. As someone who is working in network operations, architecture, engineering or IT, you probably think of the connection or “link” between routers. When we talk about external links, we mean the links between routers sitting at the edge of the Internet backbone. These are the links that exchange traffic between different networks in the internet, e.g. a CDN and an ISP.

Although operators always maintained a close eye on these links, the pandemic proved that their methods needed an upgrade. What they needed was a tool that gave them an immediate overview of their links’ traffic behavior in as few clicks as possible to see potential overload of interconnects in real-time. That is what inspired BENOCS to create the External Links Heatmap.

The External Link Heatmap

The BENOCS External Links Heatmap consists of two main graphs: a time series and a daily peak utilization table. Additionally, both elements contain customizable filters, such as date-range and a utilization-threshold slider. These features allow users to determine which links are over-utilized and for how long. They also define at what percent of utilization a link is considered highly utilized. On top of that, users can filter for specific routers, interfaces or AS numbers as well as whether the traffic is going in or out of the network.

The pandemic might slow down, the Internet traffic growth does not. Therefore, its time to consider exploring new options for network traffic analytics before the next quick surge in traffic.

Are you interested? Check out our product webpage for more information or get in touch directly with us today!

BENOCS Analytics and A1 Telekom Austria Group announce their cooperation concerning network intelligence

A1 Telekom Austria logo

Berlin, Germany – June 17, 2021 – BENOCS GmbH announced today that they are now officially supporting A1 Telekom Austria Groups network and providing detailed network traffic visibility via an easy-to-use user interface. By installing BENOCS Analytics, A1 Telekom Austria Group has acquired a high performing tool that gives them the ability to monitor traffic, troubleshoot problems, seek new business opportunities and more.

A1 Telekom Austria Group desired a quick and intuitive way to view traffic flows for forecasting, optimizing peering relationships as well as to guarantee effective and quality routing to end customers. “We are very glad to be providing A1 Telekom Austria Group with the network visibility they need in order to optimize their network and QoE,” stated Stephan Schroeder, CEO of BENOCS.

When it came to the actual set up of BENOCS Analytics, it “went very quickly. The BENOCS Engineering team provided fast and responsive support and are very knowledgeable in their field. It is always a pleasure to work with such a team,” stated  A1 Telekom Austria Groups network specialists.

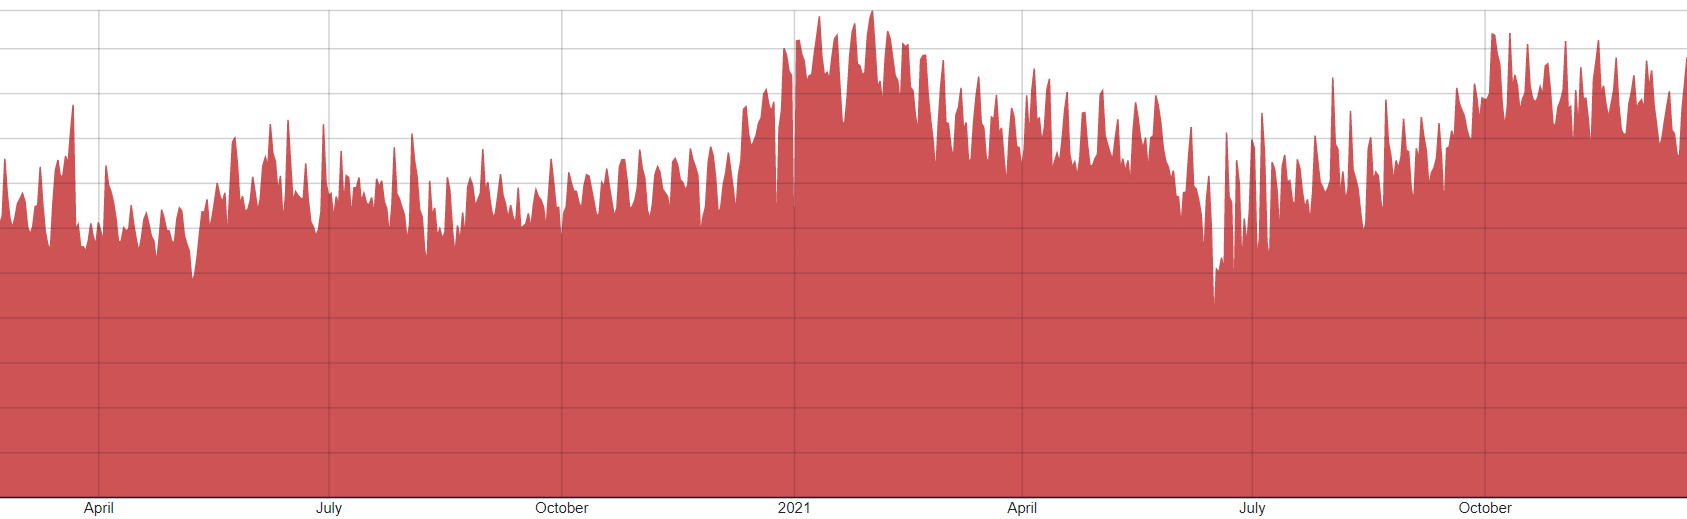
“The installation of BENOCS Analytics took place at exactly the right time in order to fulfill strict security requirements and to manage the higher traffic levels facilitated by COVID19 lockdowns. A1 Telekom Austria Groups network specialists had to do some smart upgrades to maintain high quality routes for our end users and BENOCS was of a great partner in this process. It also helps us with capacity forecasting,” said Franz Bader, Director Wholesale at A1 Telekom Austria Group.

ABOUT BENOCS

BENOCS GmbH ­ – a spin-off of Deutsche Telekom – is a small company with big plans to revolutionize the way network traffic is managed. Their intelligent and fully automated solutions fit networks of any size and provide ISPs as well as CDNs strategic ways of coping with growing network traffic. With BENOCS Analytics, network operators, transit and wholesales carriers, Hosting and CDNs gain end-to-end visibility of their entire traffic flows. www.benocs.com

About A1 Telekom Austria Group

A1 Telekom Austria Group, listed on the Vienna Stock Exchange, is a leading provider of digital services and communications solutions in Central and Eastern Europe with around 25 million customers, currently operating in seven core markets: Austria, Bulgaria, Croatia, Belarus, Slovenia, the Republic of North Macedonia and the Republic of Serbia.

Offering communications, payment and entertainment services as well as integrated business solutions, A1 Telekom Austria Group achieved revenues of 4.55 billion Euros by year end 2020. Around 18,000 employees and state of the art broadband infrastructure make digital business and lifestyle possible and enable people, companies and things to connect everywhere anytime. As European unit of América Móvil, one of the largest wireless services provider in the world, A1 Telekom Austria Group is headquartered in Vienna and gives access to global solutions. https://www.a1.group/en/home

Deutsche Telekom Global Carrier Launches IPX Navigator Monitoring of IPX Traffic Flows

IPX Navigator Screenshot

Bonn, Germany – June 10, 2021 – Deutsche Telekom Global Carrier today announced the launch of its new IPX Navigator, which was developed as a collaboration with BENOCS – a spin-off of Deutsche Telekom. It is an IPX and data roaming monitoring solution that provides advanced end-to-end monitoring of IPX traffic flow in near real time.

IPX Navigator addresses a common problem for Mobile Network Operators (MNOs). They often work with multiple IPX providers for data roaming but are unable to see detailed analytics for their IPX traffic flow. The solution provides a high-level, easy to read visualization over a customizable dashboard. It shows complete data roaming traffic flows from all partner providers over one display.

Csaba Füzesi, Head of Product Management Voice & Mobile Services at Deutsche Telekom Global Carrier, said, “We want to help our clients fulfill their mission to provide better service. IPX Navigator empowers Mobile Network Operators connected to our IPX network. With end-to-end visibility they are able to improve management of IPX commercial agreements with data-driven decisions. And that in turn allows them to optimize their technical and commercial connectivity to the data roaming ecosystem.”

IPX Navigator works with a top-down approach, meaning the visualization first gives a complete overview of roaming traffic. That includes all retail and business customers the client has in their roaming environment. Then, by simply clicking on the image, it is possible to dive deeper for more detailed views. In this way, for example, more direct routes to a destination can be made visible for the first time. Data privacy and data security are assured throughout the entire IPX Navigator solution.

The highest level of visualization is user-friendly and easy to understand, even for those without a technical background in IPX Networks. “There are so many people involved when you operate a network, and to run it effectively, all should share the same language. That’s why we put usability and intuitiveness at the forefront of our design principles,” stated Stephan Schroeder, BENOCS CEO.

About Deutsche Telekom Global Carrier

Deutsche Telekom Global Carrier is the international wholesale division of Deutsche Telekom. We offer a comprehensive portfolio for all the needs of a rapidly transforming telco industry. With more than 25 years of experience in the international wholesale communication market, Deutsche Telekom Global Carrier offers next-generation platforms, extensive networks, a global backbone, 360 degrees of security, tailor-made solutions, worldwide connectivity, and much more. https://globalcarrier.telekom.com/

About BENOCS

BENOCS GmbH –a spin-off of Deutsche Telekom –is a small company with big plans to revolutionize the way network traffic is managed. Their intelligent and fully automated solutions fit networks of any size and provide ISPs as well as CDNs strategic ways of coping with growing network traffic. With BENOCS Analytics, network operators, transit- and wholesales carriers, Hosting and CDNs gain endto-end visibility of their entire traffic flows.

Fastly outage has also led to mixed outcomes

Traffic drop during Fastly CDN outage

Yesterday, Fastly made news headlines after a configuration error led to a wide-spread failure of commercial and critical apps and websites. This phenomenon has not only led to a new general interest in the inter-workings of the Internet, but also, as most news sources reported, exposed how fragile the Internet can be.

However, in a world as complex as the Internet, it is easy to miss out on the networks that have had a different experience than those underwhelmed by Fastly traffic during this event. As a network-monitoring-as-a-service provider (amongst many other things), we at BENOCS found that not all networks we monitor showed a drop in Fastly traffic. To show you what we mean, let’s compare two networks.

What we saw

In the image above, we can see that one of the networks showed exactly what we would have expected: a large drop in traffic (about half of the average value) with a deep dip shortly before 12:00 CEST, which matches Fastly’s reported time of 9:47 UTC (11:47 CEST).

However, when comparing that to a separate network in the image below, we actually see a sharp rise in traffic on that very same day with a deep dip around the time of the outage, followed by a major spike in traffic in the hours following.

Traffic spike during Fastly CDN outage

What could have caused the differences in these networks?

As much as we would like it to be, the answer is not so simple. One theory could be that an Internet event, such as an operating system update, a gaming event or download, or possibly a large streaming event could have occurred in the second network, which did not occur in the first. A second theory could be that traffic was off-loaded into the second network from neighboring networks. Whatever the cause, we can clearly see that the traffic in the second network is nearly double than its average traffic throughout the day, while the other network remains at roughly half of its average. Very unusual behavior.

What can we learn from these two networks?

The examples mentioned above show us that, when we look behind the curtain, the real-world is more complex and may often show us different or mixed outcomes than we originally thought. In a world as complex as the Internet, it is important to remember that not all networks will react to events in the same way, and it is important to be aware of what your network is capable of.

Are you looking for a smarter way to see your network traffic and its behavior? BENOCS Analytics may be the product for you. Get in touch with us today to learn more!

Who filled my pipe? Flows on Links can help you figure that out

Screenshot BENOCS Analytics - Module - Flow Explorer

Flow analytics tools, such as our own, are great for seeing how traffic flows enters and leaves your network in order to determine its behavior. However, when it comes to answering questions such as “who filled my pipe (aka who is consuming valuable backbone capacity)?”, or “do I need to raise transit prices?”, you often find yourself limited by the information these tools can provide.

If you are using any near real-time flow analytics today, you are probably impressed with how much it can show you about your network’s traffic in just a Sankey diagram. BENOCS’ Sankey, for example, can show you the dimensions of your traffic spanning all the way from source to destination. It also reveals how traffic has entered and exited the network backbone. However, despite all of these dimensions, being able to see how traffic travels through your network is often missing. That is why BENOCS now offers Flows on Links: displaying information between network routers that don’t usually export flow (e.g. LSR’s). Using information collected from the Interior Gateway Protocol (IGP), the Flows on Links features gives users the ability to see who is sending traffic through each individual link in the network backbone.

What is IGP and why do we use it?

Although widely ignored in analytics tools, Interior Gateway Protocol (IGP) offers significant benefits when integrated in the data pool. That’s why IGP has been an integral element of BENOCS Analytics from the very start.

IGP provides the full topology overview of a network and – if augmented to flow-information – can describe the entire path a packet is using to traverse through that network. This fills the blind spot between the ingressing and egressing network borders. It also allows the application of flow-based information even on links which are not exporting any flow. Sounds magic? That’s probably because it is.

How you can benefit from IGP

With the information provided from IGP, we are able to project individual flows on Links at any point in the Internet backbone. Then, by correlating IGP with BGP, we are able to display the flow of traffic into, through and out of the network. These flows include all known dimensions, like Source, Handover, Ingress, Egress, Nexthop and Destination, which can be displayed and filtered for each network segment you want to examine. As a user, this means you receive an image of your network traffic that shows you right away which companies are “filling your pipes”.

If you were to imagine multiple streams all leading to the same river, BENOCS Flows on Links adds a different color to each stream. Therefore, when you look at the river, you can see exactly which drops of water came from which stream (as long as you imagine the colors won’t blend together).

How Can I Access Flows on Links?

BENOCS’ Flows on Links is designed for anyone looking to know who is loading their links, who is (ab-)using their network backbone, who should be charged more for transit and how to cope with network upgrades.

Sound like something you need? Get in touch with us today.

BENOCS paired with your current network analytics for a high performing network

Screenshot of BENOCS Demolytics showing the Sankey diagram, flow data and SNMP line, and time series

The Internet is a large and complex system that requires experts across diverse backgrounds to function. Common knowledge right? We think the same logic should apply to the different network analytics tools.

When it comes to choosing the analytics tool that is right for your networks, you might be enticed by companies that claim to be a “jack-of-all-trades”. This may sound like the best deal on multiple levels e.g. installation, hardware, fees, etc., but different types of networks and different functions to run a network require different types of network analytics. Would you build a house with a Swiss Army Knife or with a tool box filled with high quality tools?

With different departments such as network architecture or network security requiring different information, it always seems like the perfect solution is one that can provide features for both of them. What networks really need, however, are several different specialized tools for the same price or less. BENOCS Analytics offers customers a specialized tool that focuses on displaying large network traffic flows for peering optimization, network operations and maintenance.

If you're going to spend the time and money, spend it well

If you were to start researching for network analytics tools for enterprise or service providers, network security or DDoS defense, etc. you would find a lot of those products on the same website from the same company. Provided the costs of installation, hardware, operations, and not to mention the time spend just researching the products, these products often feel like the best deal. In the end, you may, however, end up with a tool that may only slightly improve your company’s performance.

At BENOCS, we focus on service provider analytics. Our analytics collect a combination of Netflow, BGP, IGP, DNS and SNMP from your network, aggregate it, and present it to you in a way that makes the most sense to network engineers, peering and transit managers and quality assurance departments. Our data model makes queries zippy, history accessible, overview holistic and hardware affordable.

A company that focuses mainly on DDoS protection, on the other hand, extracts more refined data from the network and presents it in a way that makes the most sense to best identify and combat a DDoS attack the moment it hits. This is a completely different specialization than the one required for network optimization and that would only benefit your network security department.

Remember that Swiss Army Knife we mentioned earlier? A great tool for putting together a temporary shelter in the woods during a weekend camping trip, but not for professional craftspeople building a sturdy house. Your employees are craftspeople looking to build and maintain a house. For the same price as buying them all a Swiss Army Knife, you could invest in a tool box filled with specialized tools to fit their individual needs.

Start filling up your tool box

When searching for the right analytics tools to meet your company’s needs, purchase the highest quality tool each company has to offer, whether it be DDoS protection, network security, enterprise network analytics, or anything else and get BENOCS Analytics for your service provider’s network analytics.

Our customers have done the same. Not only have they saved money on service fees, but they have also seen vast improvements in the performance of their employees, which has trickled down to the performance of their network. You know what they say: Good network performance leads to happy customers.

BENOCS Analytics services now available over the NL-ix platform all over Europe

NL-ix logo

Berlin, Germany – 25 November, 2020 – BENOCS GmbH and NL-ix announced that the Hosted BENOCS Analytics Service is available over the NL-ix platform. The Service is now available from the close to 100 European NL-ix enabled Data Centers

BENOCS hosted services provides customers with detailed network analytics backed by powerful data. This state-of-the-art tool gives customers full traffic flow visibility spanning multiple dimensions across the entire internet supply chain. Thus, allowing them the ability to easily spot new business opportunities, network abnormalities, and much much more.

“By connecting to the NL-ix network, we immediately spread our service all over Europe, making it available in all of the datacenters that NL-ix is in. At the same time, the ultra-low latency character of the NL-ix platform enables us to guarantee the best possible quality of our hosted services anywhere in Europe”, stated Stephan Schroeder, BENOCS CEO.

For NL-ix customers this means the BENOCS Analytics services is, via a simple additional VLAN, available over an NL-ix port, thus saving costs on installation and patches. Jerry Grondel, NL-ix Technical Product Manager states: ”The BENOCS service is another example of a SaaS application that uses NL-ix to fan-out over Europe, providing a great service with a value beyond the NL-ix network.”

About BENOCS

BENOCS GmbH – a spin-off of Deutsche Telekom – is a small company with big plans to revolutionize the way network traffic is managed. Their intelligent and fully automated solutions fit networks of any size and provide ISPs as well as CDNs strategic ways of coping with growing network traffic. With BENOCS Analytics, network operators, transit and wholesales carriers, Hosting and CDNs gain end-to-end visibility of their entire traffic flows. www.benocs.com

About NL-ix

NL-ix is Europe’s most experienced and one of the largest geo-dispersed interconnect exchanges worldwide, combining one of the world’s leading internet exchanges with a full portfolio of network, cloud and data center interconnection solutions. By leveraging NL-ix neutrality and transparency via a range of innovative tools, our customers can own, scale and orchestrate their interconnections locally, regionally, or across Europe. www.nl-ix.net

NL-ix Network Performance

NL-ix offers international transit and interconnection services as well as local peering. Unlike other transit providers, who offer a ‘black box’ connection, which is often tied to an indirect or bottle-necked route, NL-ix publishes real-time latency figures for all routes on its network as well as providing customers with tools to limit the networks they interact with through an online Route Server Configurator.

More on how the COVID19 Lockdown affected the Internet

Corona Virus

What happens to the Internet when the entire world changes their behavior at the same time? Internet traffic patterns have been growing and changing for many years. However, the rate at which these traffic patterns changed during the spring of 2020 was unprecedented. So, what did this mean for the Internet, and how did networks manage with the heavy influx of traffic?

It was no secret that human behavior patterns drastically changed due to COVID19, as we have previously stated. As government mandated lockdowns confined people to the safety of their own homes, people needed to find new ways to work, educate, socialize and entertain themselves without setting foot outside. This meant many normal face-to-face interactions needed to be digitalized.

In this post, we explore the effects the lockdown had on network traffic with information provided by the ACM IMC 2020 paper The Lockdown Effect: Implications of the COVID-19 Pandemic on Internet Traffic. This paper, for which BENOCS contributed network insights and data, set out to see exactly how much traffic patterns changed as well as to find out if these patterns were proportionate to the new behaviors as reported in the German media and media in other countries.

By examining data from different network vantage points in Europe: 1 ISP, 3 IXPs and one educational network (which consists of 16 different education institutions) between March and June, 2020. The paper identifies significant changes in traffic volumes from the shift in human behavior and shows how it compares to the expected behavior as stated in the media.

Increases in ISP and IXP traffic

Over the last two decades, Internet user profiles changed significantly but at a steady pace. This gave operators ample time to adjust their networks accordingly. However, the effects of COVID-19 hit the Internet like a great storm, causing traffic levels to flood, thus testing the stability of its infrastructure – as storms typically do. In just a few weeks’ time, ISP and IXP traffic specifically in southern Europe increased more than 20% at the beginning of the forced lock-downs. This traffic shows a steady decrease in May 2020, as those areas began to loosen their lock-down restrictions. Not surprisingly, what they found was a traffic increase by 15-20% with a significant amount of growth during off-peak hour times (weekdays from 8AM-7PM), and mainly in residential areas.

I am text block. Click edit button to change this text. Lorem ipsum dolor sit amet, consectetur adipiscing elit. Ut elit tellus, luctus nec ullamcorper mattis, pulvinar dapibus leo.

Regular Weekday Traffic Reaches Volumes Similar to Peak-Hours

When looking at the behavior of the traffic, there appeared to be a significant shift, especially on weekdays both during the day and in the evening. In fact, the traffic during this time – typically less utilized ­– began to behave like weekend traffic – typically highly utilized. By testing different vantage points in the European Union, communication, entertainment and social media applications show a strong growth, particularly on weekdays during standard working hours. This tells us that many weekday in-face interactions such as meetings, shopping and schooling were performed at home and online.

The migration of employees into a working from home environment also reflected in network traffic. Due to the influx of employees suddenly working from home, VPN traffic also showed substantial weekday growth, with rates having grown 200% between February and March 2020. The traffic then reduces back to pre-lockdown levels as lock down restrictions loosened and more employees returned to their offices instead of working from home.

Lastly, the academic education network, which is a connection of 16 different networks, shows a drastic change during the lockdown. More specifically, a shift in daily peaks, with behaviors shifting to the middle of the night, thus showing students working from abroad, possibly due to restrictions on entering Germany or even Europe.

The Outcome

Taking all of the information from the vantage points into consideration, we can conclude that the network behaved exactly how one would predict, given how much news coverage at that time focused on the digitalization of work, education and events. How did the ISP fair in all of this? Despite the rise in traffic volumes and the extreme shift in traffic behavior, ISPs, specifically in Germany, have proved the preparedness of their infrastructure. There is no evidence of the increase of traffic impacting Internet operations, despite the 15-20% link capacity increase. However, this is and was easily solved with upgrading and building-out. Additionally, network operators often have plans for spikes in network traffic even long before the COVID-19 outbreak, thus ensuring such volumes would not disrupt their services.

How to stay future-proof

How do network operators know when an upgrade or a build-out is necessary? Network analytics has been around for years, however, now more than EVER has it become a crucial part of routine network operations. As more companies begin to announce their plans to grow their businesses digitally in a post-Corona society, network providers and operators can expect a continuation of rapid traffic growth. In order to guarantee the best quality of service, you need to remain ahead, and the best way to do that is through network Analytics.

The information in this post comes from the paper “The Lockdown Effect: Implications of the COVID-19 Pandemic on Internet Traffic.” To read the full study, please click here.