Probes are great for spotting issues at the network edge, but how do you know what their alerts actually mean for the rest of your traffic? And how can you link those warnings back to the exact interconnect point?
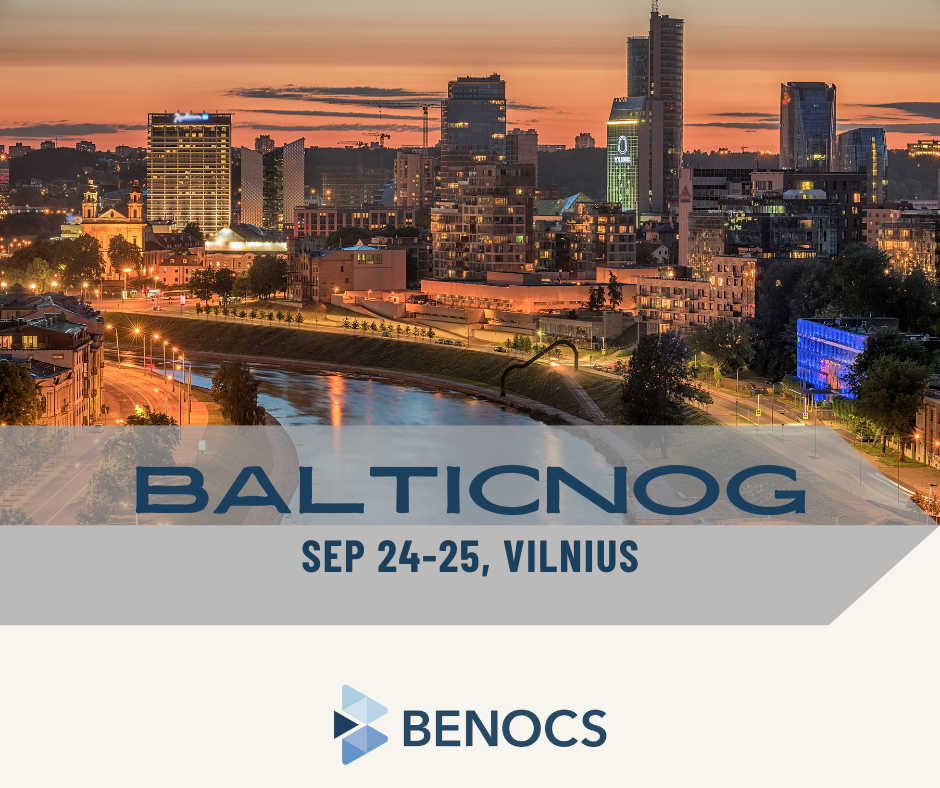
At BalticNOG you will find out!
On Tuesday, September 24, at 5:00pm, Péter will share a hands-on example showing you how to:
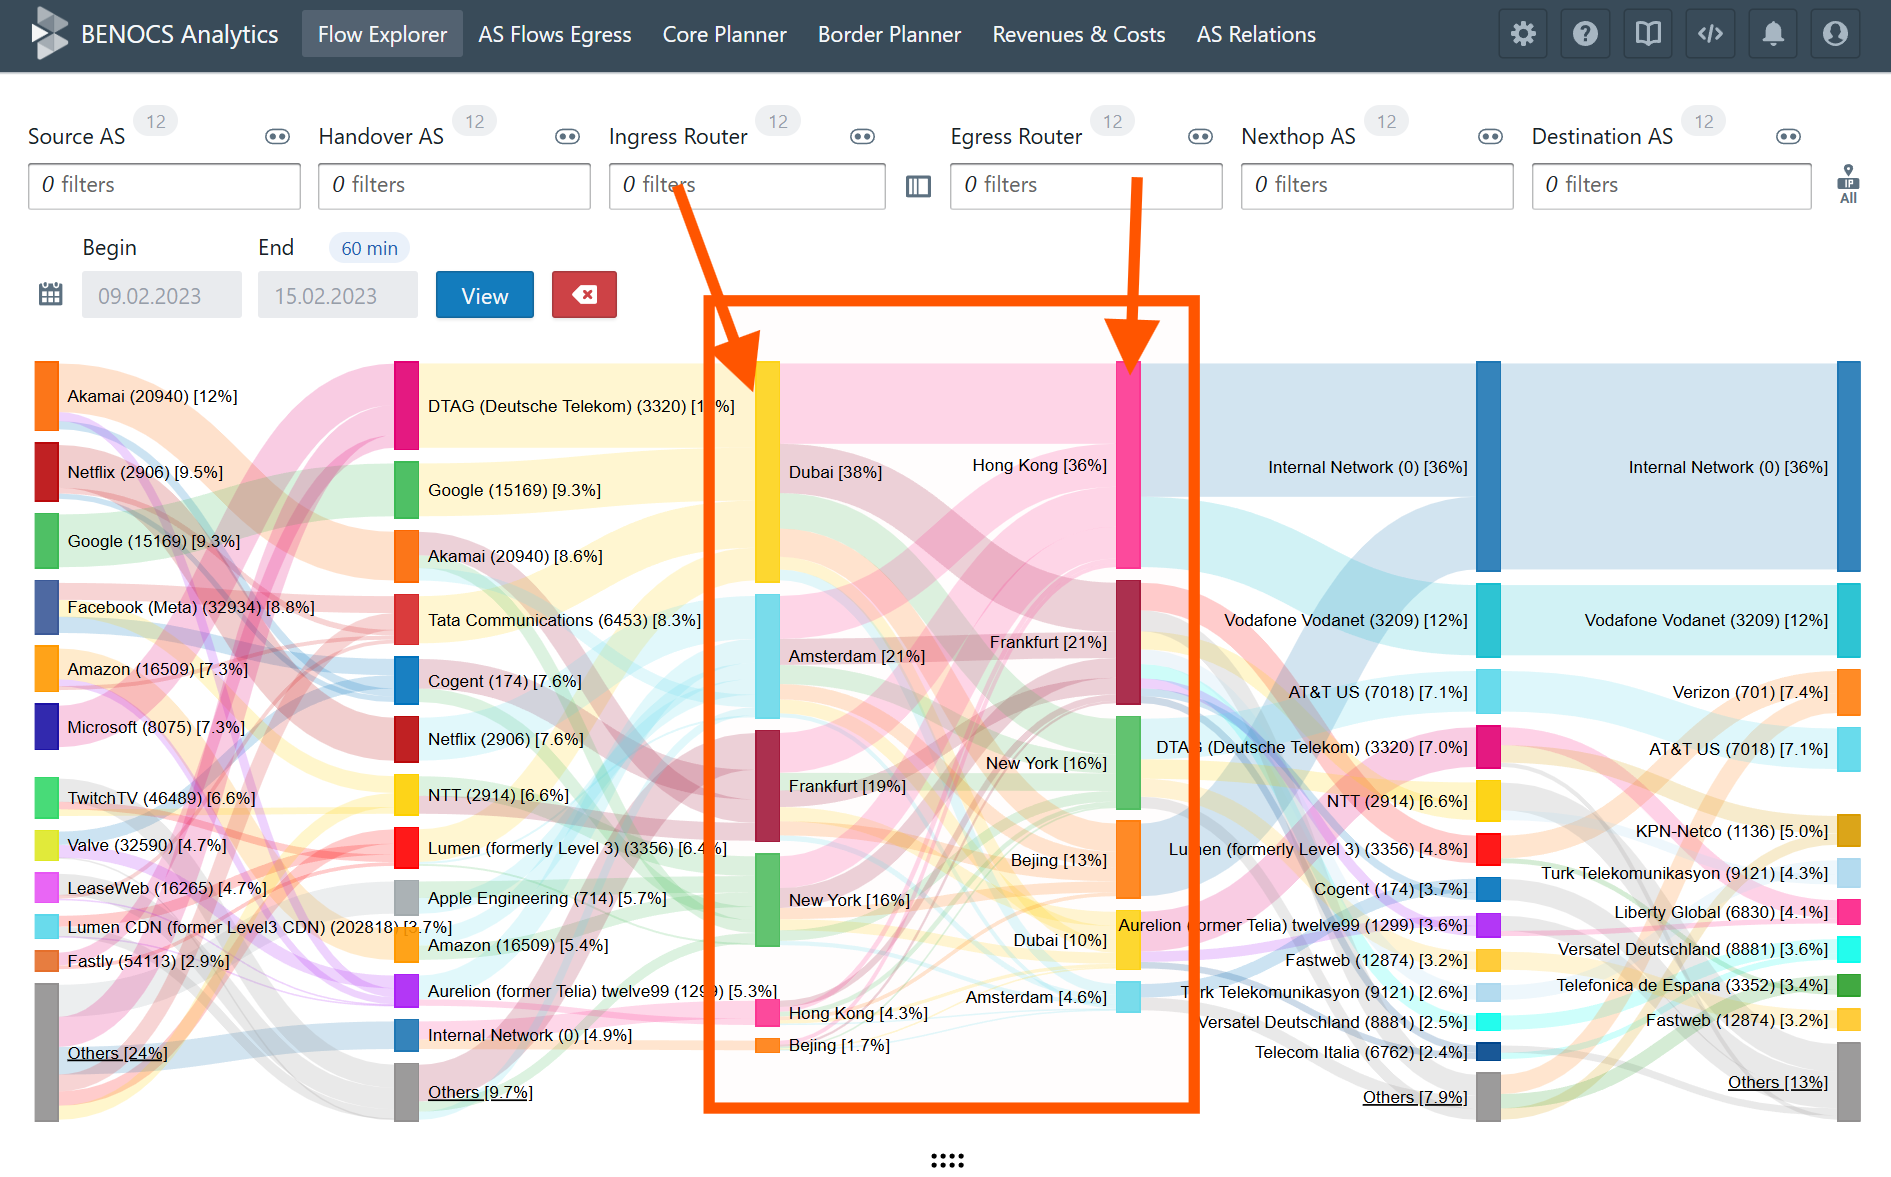
- Firmly map probes to their interconnect points.
- Identify which other traffic flows are likely affected by the same problem.
It’s about turning probe alerts from isolated warnings into actionable insights that help you understand the bigger picture.
If you’re at BalticNOG, don’t miss Peter’s talk, especially if you’re curious about making flow-based monitoring more accurate, efficient, and useful.