Deutsche Telekom Global Carrier Launches IPX Navigator Monitoring of IPX Traffic Flows

IPX Navigator Screenshot

Bonn, Germany – June 10, 2021 – Deutsche Telekom Global Carrier today announced the launch of its new IPX Navigator, which was developed as a collaboration with BENOCS – a spin-off of Deutsche Telekom. It is an IPX and data roaming monitoring solution that provides advanced end-to-end monitoring of IPX traffic flow in near real time.

IPX Navigator addresses a common problem for Mobile Network Operators (MNOs). They often work with multiple IPX providers for data roaming but are unable to see detailed analytics for their IPX traffic flow. The solution provides a high-level, easy to read visualization over a customizable dashboard. It shows complete data roaming traffic flows from all partner providers over one display.

Csaba Füzesi, Head of Product Management Voice & Mobile Services at Deutsche Telekom Global Carrier, said, “We want to help our clients fulfill their mission to provide better service. IPX Navigator empowers Mobile Network Operators connected to our IPX network. With end-to-end visibility they are able to improve management of IPX commercial agreements with data-driven decisions. And that in turn allows them to optimize their technical and commercial connectivity to the data roaming ecosystem.”

IPX Navigator works with a top-down approach, meaning the visualization first gives a complete overview of roaming traffic. That includes all retail and business customers the client has in their roaming environment. Then, by simply clicking on the image, it is possible to dive deeper for more detailed views. In this way, for example, more direct routes to a destination can be made visible for the first time. Data privacy and data security are assured throughout the entire IPX Navigator solution.

The highest level of visualization is user-friendly and easy to understand, even for those without a technical background in IPX Networks. “There are so many people involved when you operate a network, and to run it effectively, all should share the same language. That’s why we put usability and intuitiveness at the forefront of our design principles,” stated Stephan Schroeder, BENOCS CEO.

About Deutsche Telekom Global Carrier

Deutsche Telekom Global Carrier is the international wholesale division of Deutsche Telekom. We offer a comprehensive portfolio for all the needs of a rapidly transforming telco industry. With more than 25 years of experience in the international wholesale communication market, Deutsche Telekom Global Carrier offers next-generation platforms, extensive networks, a global backbone, 360 degrees of security, tailor-made solutions, worldwide connectivity, and much more. https://globalcarrier.telekom.com/

About BENOCS

BENOCS GmbH –a spin-off of Deutsche Telekom –is a small company with big plans to revolutionize the way network traffic is managed. Their intelligent and fully automated solutions fit networks of any size and provide ISPs as well as CDNs strategic ways of coping with growing network traffic. With BENOCS Analytics, network operators, transit- and wholesales carriers, Hosting and CDNs gain endto-end visibility of their entire traffic flows.

Fastly outage has also led to mixed outcomes

Traffic drop during Fastly CDN outage

Yesterday, Fastly made news headlines after a configuration error led to a wide-spread failure of commercial and critical apps and websites. This phenomenon has not only led to a new general interest in the inter-workings of the Internet, but also, as most news sources reported, exposed how fragile the Internet can be.

However, in a world as complex as the Internet, it is easy to miss out on the networks that have had a different experience than those underwhelmed by Fastly traffic during this event. As a network-monitoring-as-a-service provider (amongst many other things), we at BENOCS found that not all networks we monitor showed a drop in Fastly traffic. To show you what we mean, let’s compare two networks.

What we saw

In the image above, we can see that one of the networks showed exactly what we would have expected: a large drop in traffic (about half of the average value) with a deep dip shortly before 12:00 CEST, which matches Fastly’s reported time of 9:47 UTC (11:47 CEST).

However, when comparing that to a separate network in the image below, we actually see a sharp rise in traffic on that very same day with a deep dip around the time of the outage, followed by a major spike in traffic in the hours following.

Traffic spike during Fastly CDN outage

What could have caused the differences in these networks?

As much as we would like it to be, the answer is not so simple. One theory could be that an Internet event, such as an operating system update, a gaming event or download, or possibly a large streaming event could have occurred in the second network, which did not occur in the first. A second theory could be that traffic was off-loaded into the second network from neighboring networks. Whatever the cause, we can clearly see that the traffic in the second network is nearly double than its average traffic throughout the day, while the other network remains at roughly half of its average. Very unusual behavior.

What can we learn from these two networks?

The examples mentioned above show us that, when we look behind the curtain, the real-world is more complex and may often show us different or mixed outcomes than we originally thought. In a world as complex as the Internet, it is important to remember that not all networks will react to events in the same way, and it is important to be aware of what your network is capable of.

Are you looking for a smarter way to see your network traffic and its behavior? BENOCS Analytics may be the product for you. Get in touch with us today to learn more!

Who filled my pipe? Flows on Links can help you figure that out

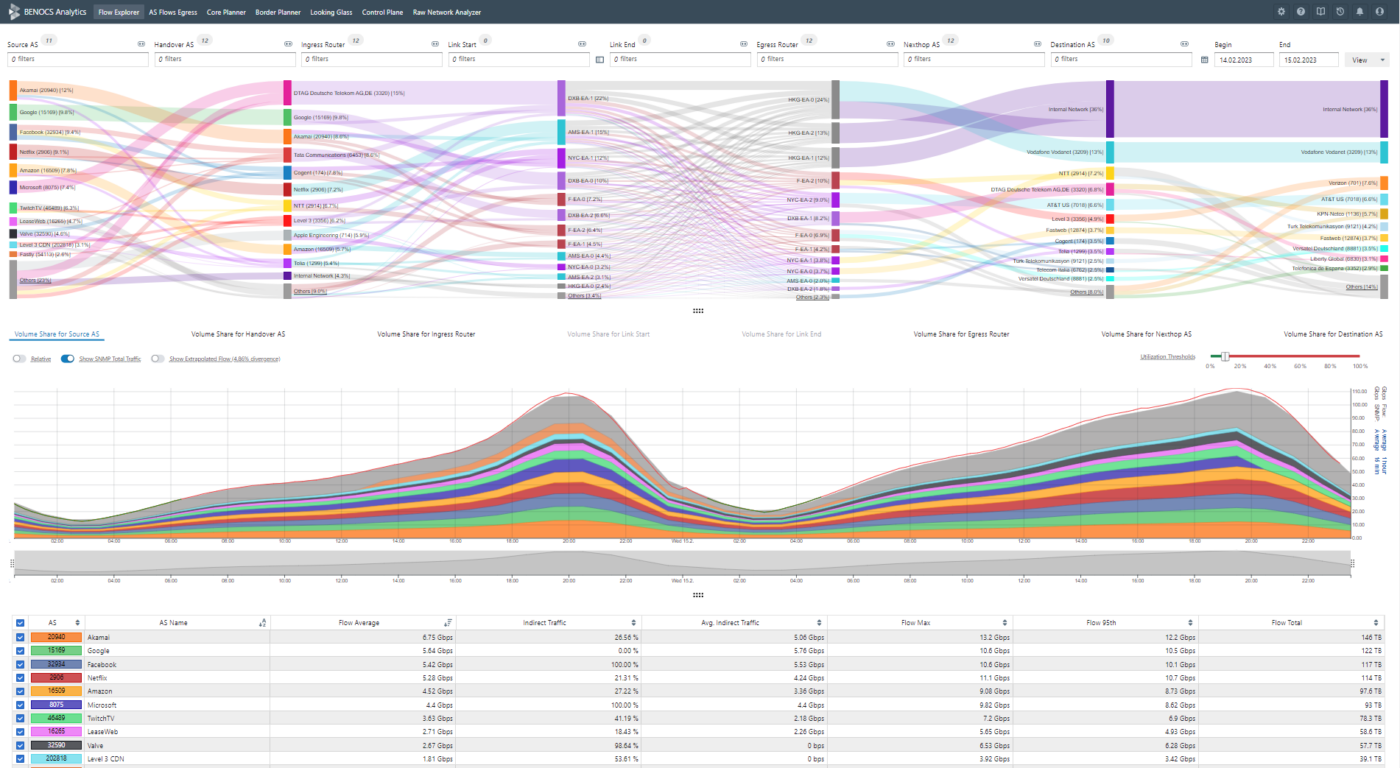
Screenshot BENOCS Analytics - Module - Flow Explorer

Flow analytics tools, such as our own, are great for seeing how traffic flows enters and leaves your network in order to determine its behavior. However, when it comes to answering questions such as “who filled my pipe (aka who is consuming valuable backbone capacity)?”, or “do I need to raise transit prices?”, you often find yourself limited by the information these tools can provide.

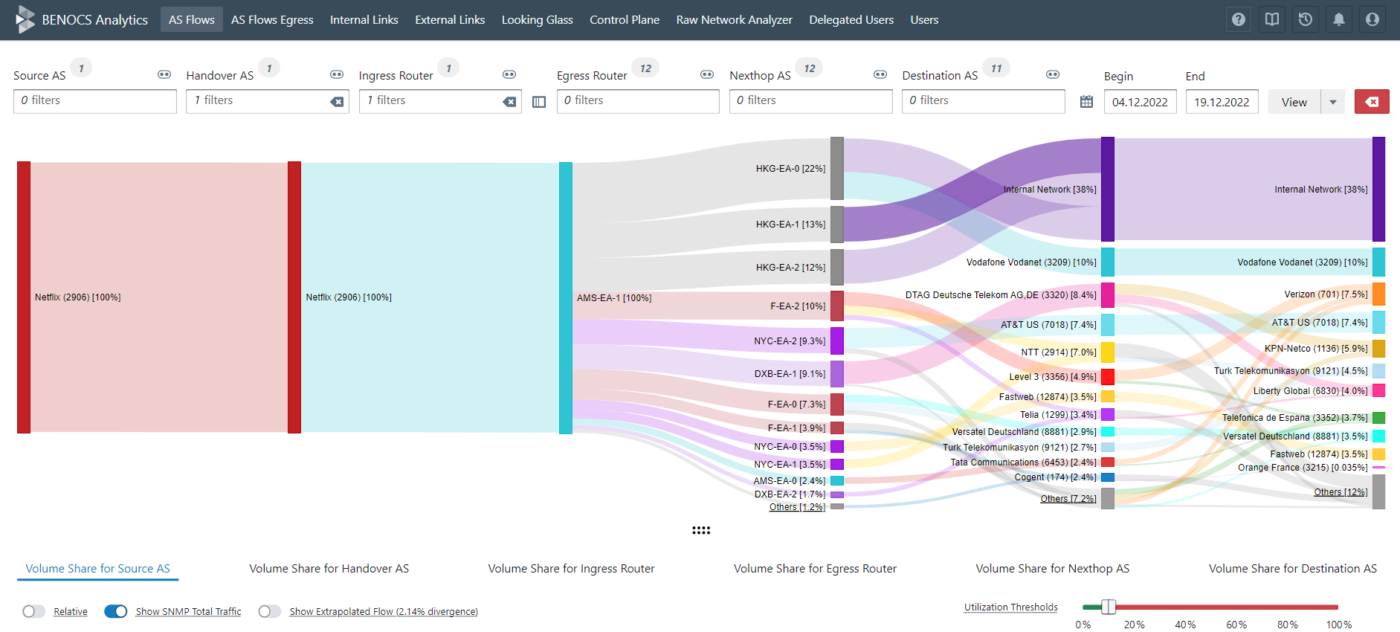
If you are using any near real-time flow analytics today, you are probably impressed with how much it can show you about your network’s traffic in just a Sankey diagram. BENOCS’ Sankey, for example, can show you the dimensions of your traffic spanning all the way from source to destination. It also reveals how traffic has entered and exited the network backbone. However, despite all of these dimensions, being able to see how traffic travels through your network is often missing. That is why BENOCS now offers Flows on Links: displaying information between network routers that don’t usually export flow (e.g. LSR’s). Using information collected from the Interior Gateway Protocol (IGP), the Flows on Links features gives users the ability to see who is sending traffic through each individual link in the network backbone.

What is IGP and why do we use it?

Although widely ignored in analytics tools, Interior Gateway Protocol (IGP) offers significant benefits when integrated in the data pool. That’s why IGP has been an integral element of BENOCS Analytics from the very start.

IGP provides the full topology overview of a network and – if augmented to flow-information – can describe the entire path a packet is using to traverse through that network. This fills the blind spot between the ingressing and egressing network borders. It also allows the application of flow-based information even on links which are not exporting any flow. Sounds magic? That’s probably because it is.

How you can benefit from IGP

With the information provided from IGP, we are able to project individual flows on Links at any point in the Internet backbone. Then, by correlating IGP with BGP, we are able to display the flow of traffic into, through and out of the network. These flows include all known dimensions, like Source, Handover, Ingress, Egress, Nexthop and Destination, which can be displayed and filtered for each network segment you want to examine. As a user, this means you receive an image of your network traffic that shows you right away which companies are “filling your pipes”.

If you were to imagine multiple streams all leading to the same river, BENOCS Flows on Links adds a different color to each stream. Therefore, when you look at the river, you can see exactly which drops of water came from which stream (as long as you imagine the colors won’t blend together).

How Can I Access Flows on Links?

BENOCS’ Flows on Links is designed for anyone looking to know who is loading their links, who is (ab-)using their network backbone, who should be charged more for transit and how to cope with network upgrades.

Sound like something you need? Get in touch with us today.

BENOCS paired with your current network analytics for a high performing network

Screenshot of BENOCS Demolytics showing the Sankey diagram, flow data and SNMP line, and time series

The Internet is a large and complex system that requires experts across diverse backgrounds to function. Common knowledge right? We think the same logic should apply to the different network analytics tools.

When it comes to choosing the analytics tool that is right for your networks, you might be enticed by companies that claim to be a “jack-of-all-trades”. This may sound like the best deal on multiple levels e.g. installation, hardware, fees, etc., but different types of networks and different functions to run a network require different types of network analytics. Would you build a house with a Swiss Army Knife or with a tool box filled with high quality tools?

With different departments such as network architecture or network security requiring different information, it always seems like the perfect solution is one that can provide features for both of them. What networks really need, however, are several different specialized tools for the same price or less. BENOCS Analytics offers customers a specialized tool that focuses on displaying large network traffic flows for peering optimization, network operations and maintenance.

If you're going to spend the time and money, spend it well

If you were to start researching for network analytics tools for enterprise or service providers, network security or DDoS defense, etc. you would find a lot of those products on the same website from the same company. Provided the costs of installation, hardware, operations, and not to mention the time spend just researching the products, these products often feel like the best deal. In the end, you may, however, end up with a tool that may only slightly improve your company’s performance.

At BENOCS, we focus on service provider analytics. Our analytics collect a combination of Netflow, BGP, IGP, DNS and SNMP from your network, aggregate it, and present it to you in a way that makes the most sense to network engineers, peering and transit managers and quality assurance departments. Our data model makes queries zippy, history accessible, overview holistic and hardware affordable.

A company that focuses mainly on DDoS protection, on the other hand, extracts more refined data from the network and presents it in a way that makes the most sense to best identify and combat a DDoS attack the moment it hits. This is a completely different specialization than the one required for network optimization and that would only benefit your network security department.

Remember that Swiss Army Knife we mentioned earlier? A great tool for putting together a temporary shelter in the woods during a weekend camping trip, but not for professional craftspeople building a sturdy house. Your employees are craftspeople looking to build and maintain a house. For the same price as buying them all a Swiss Army Knife, you could invest in a tool box filled with specialized tools to fit their individual needs.

Start filling up your tool box

When searching for the right analytics tools to meet your company’s needs, purchase the highest quality tool each company has to offer, whether it be DDoS protection, network security, enterprise network analytics, or anything else and get BENOCS Analytics for your service provider’s network analytics.

Our customers have done the same. Not only have they saved money on service fees, but they have also seen vast improvements in the performance of their employees, which has trickled down to the performance of their network. You know what they say: Good network performance leads to happy customers.

BENOCS Analytics services now available over the NL-ix platform all over Europe

NL-ix logo

Berlin, Germany – 25 November, 2020 – BENOCS GmbH and NL-ix announced that the Hosted BENOCS Analytics Service is available over the NL-ix platform. The Service is now available from the close to 100 European NL-ix enabled Data Centers

BENOCS hosted services provides customers with detailed network analytics backed by powerful data. This state-of-the-art tool gives customers full traffic flow visibility spanning multiple dimensions across the entire internet supply chain. Thus, allowing them the ability to easily spot new business opportunities, network abnormalities, and much much more.

“By connecting to the NL-ix network, we immediately spread our service all over Europe, making it available in all of the datacenters that NL-ix is in. At the same time, the ultra-low latency character of the NL-ix platform enables us to guarantee the best possible quality of our hosted services anywhere in Europe”, stated Stephan Schroeder, BENOCS CEO.

For NL-ix customers this means the BENOCS Analytics services is, via a simple additional VLAN, available over an NL-ix port, thus saving costs on installation and patches. Jerry Grondel, NL-ix Technical Product Manager states: ”The BENOCS service is another example of a SaaS application that uses NL-ix to fan-out over Europe, providing a great service with a value beyond the NL-ix network.”

About BENOCS

BENOCS GmbH – a spin-off of Deutsche Telekom – is a small company with big plans to revolutionize the way network traffic is managed. Their intelligent and fully automated solutions fit networks of any size and provide ISPs as well as CDNs strategic ways of coping with growing network traffic. With BENOCS Analytics, network operators, transit and wholesales carriers, Hosting and CDNs gain end-to-end visibility of their entire traffic flows. www.benocs.com

About NL-ix

NL-ix is Europe’s most experienced and one of the largest geo-dispersed interconnect exchanges worldwide, combining one of the world’s leading internet exchanges with a full portfolio of network, cloud and data center interconnection solutions. By leveraging NL-ix neutrality and transparency via a range of innovative tools, our customers can own, scale and orchestrate their interconnections locally, regionally, or across Europe. www.nl-ix.net

NL-ix Network Performance

NL-ix offers international transit and interconnection services as well as local peering. Unlike other transit providers, who offer a ‘black box’ connection, which is often tied to an indirect or bottle-necked route, NL-ix publishes real-time latency figures for all routes on its network as well as providing customers with tools to limit the networks they interact with through an online Route Server Configurator.

More on how the COVID19 Lockdown affected the Internet

Corona Virus

What happens to the Internet when the entire world changes their behavior at the same time? Internet traffic patterns have been growing and changing for many years. However, the rate at which these traffic patterns changed during the spring of 2020 was unprecedented. So, what did this mean for the Internet, and how did networks manage with the heavy influx of traffic?

It was no secret that human behavior patterns drastically changed due to COVID19, as we have previously stated. As government mandated lockdowns confined people to the safety of their own homes, people needed to find new ways to work, educate, socialize and entertain themselves without setting foot outside. This meant many normal face-to-face interactions needed to be digitalized.

In this post, we explore the effects the lockdown had on network traffic with information provided by the ACM IMC 2020 paper The Lockdown Effect: Implications of the COVID-19 Pandemic on Internet Traffic. This paper, for which BENOCS contributed network insights and data, set out to see exactly how much traffic patterns changed as well as to find out if these patterns were proportionate to the new behaviors as reported in the German media and media in other countries.

By examining data from different network vantage points in Europe: 1 ISP, 3 IXPs and one educational network (which consists of 16 different education institutions) between March and June, 2020. The paper identifies significant changes in traffic volumes from the shift in human behavior and shows how it compares to the expected behavior as stated in the media.

Increases in ISP and IXP traffic

Over the last two decades, Internet user profiles changed significantly but at a steady pace. This gave operators ample time to adjust their networks accordingly. However, the effects of COVID-19 hit the Internet like a great storm, causing traffic levels to flood, thus testing the stability of its infrastructure – as storms typically do. In just a few weeks’ time, ISP and IXP traffic specifically in southern Europe increased more than 20% at the beginning of the forced lock-downs. This traffic shows a steady decrease in May 2020, as those areas began to loosen their lock-down restrictions. Not surprisingly, what they found was a traffic increase by 15-20% with a significant amount of growth during off-peak hour times (weekdays from 8AM-7PM), and mainly in residential areas.

I am text block. Click edit button to change this text. Lorem ipsum dolor sit amet, consectetur adipiscing elit. Ut elit tellus, luctus nec ullamcorper mattis, pulvinar dapibus leo.

Regular Weekday Traffic Reaches Volumes Similar to Peak-Hours

When looking at the behavior of the traffic, there appeared to be a significant shift, especially on weekdays both during the day and in the evening. In fact, the traffic during this time – typically less utilized ­– began to behave like weekend traffic – typically highly utilized. By testing different vantage points in the European Union, communication, entertainment and social media applications show a strong growth, particularly on weekdays during standard working hours. This tells us that many weekday in-face interactions such as meetings, shopping and schooling were performed at home and online.

The migration of employees into a working from home environment also reflected in network traffic. Due to the influx of employees suddenly working from home, VPN traffic also showed substantial weekday growth, with rates having grown 200% between February and March 2020. The traffic then reduces back to pre-lockdown levels as lock down restrictions loosened and more employees returned to their offices instead of working from home.

Lastly, the academic education network, which is a connection of 16 different networks, shows a drastic change during the lockdown. More specifically, a shift in daily peaks, with behaviors shifting to the middle of the night, thus showing students working from abroad, possibly due to restrictions on entering Germany or even Europe.

The Outcome

Taking all of the information from the vantage points into consideration, we can conclude that the network behaved exactly how one would predict, given how much news coverage at that time focused on the digitalization of work, education and events. How did the ISP fair in all of this? Despite the rise in traffic volumes and the extreme shift in traffic behavior, ISPs, specifically in Germany, have proved the preparedness of their infrastructure. There is no evidence of the increase of traffic impacting Internet operations, despite the 15-20% link capacity increase. However, this is and was easily solved with upgrading and building-out. Additionally, network operators often have plans for spikes in network traffic even long before the COVID-19 outbreak, thus ensuring such volumes would not disrupt their services.

How to stay future-proof

How do network operators know when an upgrade or a build-out is necessary? Network analytics has been around for years, however, now more than EVER has it become a crucial part of routine network operations. As more companies begin to announce their plans to grow their businesses digitally in a post-Corona society, network providers and operators can expect a continuation of rapid traffic growth. In order to guarantee the best quality of service, you need to remain ahead, and the best way to do that is through network Analytics.

The information in this post comes from the paper “The Lockdown Effect: Implications of the COVID-19 Pandemic on Internet Traffic.” To read the full study, please click here.

Leading China Telecom Global now supported by BENOCS Analytics

China Telecom logo

Berlin, Germany – Oct. 16, 2020 – BENOCS GmbH announced today that they, together with MarvelTec, are now supporting China Telecom Global – one of China’s largest carrier networks – with network intelligence and visibility. Implementing BENOCS Analytics provides this carrier with a high performing tool to monitor traffic, trouble shoot failures, seek new business opportunities and more.

China Telekom Global needed an Analytics tool that would provide them with visibility of their IP supply chain to help them fully understand their Internet traffic as well as allow their customers and partners to optimize their performance. The “BENOCS Analytics Tool is straightforward and really easy to use. One tool fits for both network and commercial professions.” Stated a spokesperson for China Telecom Global. “We expect to have more innovative features to help us better optimize our network as well as new IP related products.”

Especially for entities as large as China Telecom Global, having basic visibility is essential, however, having the right visibility makes all the difference. “Having access to powerful data is an absolute necessity for the future of networks,” stated Stephan Schroeder, BENOCS CEO. “We look forward to supporting China Telekom Global and to bringing value to their network.”

About BENOCS

BENOCS GmbH – a spin-off of Deutsche Telekom – is a small company with big plans to revolutionize the way network traffic is managed. Their intelligent and fully automated solutions fit networks of any size and provide ISPs as well as CDNs strategic ways of coping with growing network traffic. With BENOCS Analytics, network operators, transit and wholesales carriers, Hosting and CDNs gain end-to-end visibility of their entire traffic flows.
About China Telecom Global

China Telecom Global (CTG) is currently one of the world’s largest providers of integrated telecommunication services, continuously striving to enhance its capabilities in managing global operation to keep pace with changing times. With their abundance of resources in mainland China as well as branches and affiliates in 42 countries and regions, CTG connects the Asia Pacific region and the world and has fast become a world-class integrated information service provider.

Not every network’s traffic increased during the COVID19 lockdowns

Corona Virus Lockdown - Stay at home

Since the period when most governments started mandating lockdowns and encouraging social distancing at the beginning of 2020, many network operators, SaaS, OTT providers and CDNs have been reporting unprecedented spikes in traffic volumes and content demand. But what about the other side of the coin? If the demand for the Internet increased, did traffic volumes on every network increase? The answer may surprise you.

In the late winter of 2020, the utilization of the Internet as well as network traffic volumes rose to unprecedented levels on most networks. Although traffic volumes on ISP and mobile operating networks grew, IPX (IP Exchange) networks experience a sharp plunge during the government-mandated lockdowns, despite the billions of Internet users left homebound of several weeks. This happened because IPX networks are used when users are mobile, not stationary.

What is an IPX network?

IPX networks (not to be confused with IXPs) have been a part of the network ecosystem since 2008 for mobile operators and other service providers. Their primary purpose allows for the exchange of Internet Protocol traffic securely and at the expected quality of service to provide reliable Internet access for mobile users outside of their home country. This is especially prevalent on continents such as the Europe, where users cross country (and network) borders regularly, but still use the mobile data of their home country provider. For example, a French mobile data user can travel in Spain (within the Spanish network), and still receive service with the same or similar quality as if they were still in their home (French) network. Additionally, IPX networks make handling roaming easier for operators due to its multilateral or bilateral interconnection. This means that IPX providers to some extent either handle the contract and connectivity for operators or allow operators to sort that out among themselves.

Why did IPX traffic decrease during lockdown?

One of the most significant outcomes of the COVID19 lockdowns is the new demand for Internet services. In order to maintain a sense of “normality”, most everyday activities moved online, which challenged the sustainability of many network operators and content providers. For that reason, it has become more crucial for network operators to have excellent visibility and knowledge of network traffic behavior.

At BENOCS, we offer network analytics solutions for ISP and IPX networks. Our solutions are backed by powerful data to allow you and your team the visibility you need to make informed decisions about your network operations. To learn more about our analytics products, please click here.

BENOCS aligns with MCT Telco Global to spread network intelligence globally

MCT Telco Global logo

Berlin, Germany – Sep 14, 2020 – BENOCS GmbH and MCT Telco Global announce their new partnership to further spread network intelligence through the telecom world. With support from MCT Telco Global, Internet Service Providers and Telecoms in the Middle East and parts of Asia will now have easier access to the implementation of BENOCS intelligent solutions directly into their networks.

The new alliance with MCT Telco Global was established to open up new windows of opportunities for BENOCS GmbH outside of their European headquarters. “We are excited about MCT Telco Global’s broad relationship network and the extended reach to engage trustfully with potential customers in the region” Stated Stephan Schroeder, CEO at BENOCS GmbH.

“More bandwidth for internet, seamless communication and uninterrupted connectivity are extremely critical all over the world, which is currently affected by Covid-19 pandemic. By uniting BENOCS’ deep experience in telecommunication industry, its technology and products with MCT Telco Global’s customer base, we will be able to present higher quality, latest technology products to the clients which will enable them to provide wide range of communication services” stated Mehmet C. Toros, CEO at MCT Telco Global.

About BENOCS

BENOCS GmbH – a spin-off of Deutsche Telekom – is a small company with big plans to revolutionize the way network traffic is managed. Their intelligent and fully automated solutions fit networks of any size and provide ISPs as well as CDNs strategic ways of coping with growing network traffic. With BENOCS Analytics, network operators, transit and wholesales carriers, Hosting and CDNs gain end-to-end visibility of their entire traffic flows.
About MCT Telco Global

MCT Telco Global is a specialized company in telecommunication and IT industry, which provides contribution to the clients to increase and sustain the growth, implement new technologies, find and unlash its hidden potentials. Having 25+ years’ experience of executives, wide partnerships with technology companies and its own products, MCT Telco Global offers the products and services to Telcos and Wholesale & Carrier Companies.

Network traffic patterns change during COVID19 lock-downs

ISP traffic during COVID19 lockdown

COVID19 proved to be a challenge for Internet Service Providers (ISPs). As countries began locking-down, consumer demand for the Internet surged, flooding the network pipelines. However, despite these challenges, the Internet managed maintain its strength.

Whether it is due to mandatory lock-downs and quarantines or simply following the advice to stay home, end-users all over the world are finding new ways to stay entertained and connected with one another while maintaining social distance. During the global pandemic – COVID 19 – that struck at the end of 2019 and early 2020, more people than ever began moving their lives into the virtual realm. Schools, work places, social gathering, conferences, leisure activities, etc., which would normally rely very little on the Internet, have moved substantially to the Internet in an attempt to keep functioning. On top of that, staying indoors meant that many relied on streaming services more than ever to keep themselves entertained. For the Internet, this meant an unprecedented increase of traffic in a very short amount of time. In Germany alone, where citizens faced a loose lock-down/contact ban – meaning citizens could go outside for solo activities but needed to keep 1.5 meters distance from everyone – network patterns changed to being highly utilized almost all of the time.

A Surge in traffic during office hours

Before countries and states began COVID19 lock-downs, the Internet usually carried the most traffic during typical leisure times i.e. evenings (6PM to 10PM), weekends, and public holidays. A much lower amount of traffic was distributed during normal working hours (8AM-6PM).  However, during the loose lock-down/contact ban in Germany, which started in March 23rd, 2020, network operators saw a significant increase in internet traffic during workday hours and weekends, revealing that people were supplementing face-to-face activities, such everyday office conversations, school attendance, and social activities as well entertainment with online versions. This induced much longer periods of heavy network utilization.

A shift in traffic patterns

If we look at the figure above, we can compare pre-COVID19 traffic patterns with the traffic patterns sampled during the loosened lock-down to understand how user behavior changed. We see that, since 2018, most traffic in Germany behaved according to the assigned days ­– weekends behaved like weekends and weekdays behaved like weekdays – with a few exceptions. However, if we look at the period between the end of March and the beginning of June, we can see that traffic patterns for specific days no longer fall within their respective categories. Instead, we see that most of the days falls into the holiday category – a day associated with heavy utilization.

What these traffic patterns tell us

With most of the days during the loose lock-down/contact ban in Germany falling into the holiday category, we conclude that people are supplementing the usual face-to-face and outdoor activities with internet-based versions. Speaking with colleagues, attending classes or chatting with friends, as well as streaming videos and games all add more traffic to the network.

What we might see in the future

As scientist learn and reveal more about how to prevent the spread of COVID-19, German government officials are beginning to re-open states and loosen social contact rules. However, the quick shift to virtual contact combined with the networks ability to cope has many people wondering if they want to return to their pre-COVID19 ways. With that being said, we can most likely expect that the network utilization we saw during the crisis to remain an ongoing trend rather a one-hit wonder.

To stay ahead of the trends, it is important for ISPs and network operators to have a visibility into their network traffic behavior. With BENOCS Analytics, you too can ensure your network is ready for the increasing traffic volumes as well as any other long-term spikes in utilization.