With the 2026 FIFA World Cup kicking off today, ISPs and other telecommunication networks likely have some concerns as to how their network and infrastructure will react to the massive traffic demands. Live global sporting events like the World Cup represent an extreme test for even the largest backbone networks.
In this sense, historical telemetry data provides valuable insights on customer behavior; it enables a clear understanding of how quickly multimedia usage evolves; and it gives service providers the necessary analytical tools to predict and prevent congestion.
The following analysis explores the evolution of streaming traffic over two consecutive FIFA World Cups (Russia 2018 and Qatar 2022) at a large European ISP. We will illustrate the massive transition from traditional broadcast TV to Internet-first streaming, and discuss the multiple CDNs that are now used to keep the internet running smoothly during these massive live events.
(To maintain confidentiality, the telemetry data presented here has been normalized. All traffic volumes are scaled relative to the absolute maximum ingress peak observed during the 2022 tournament, which serves as our 1.0 baseline.)
The Paradigm Shift: 2018 vs. 2022
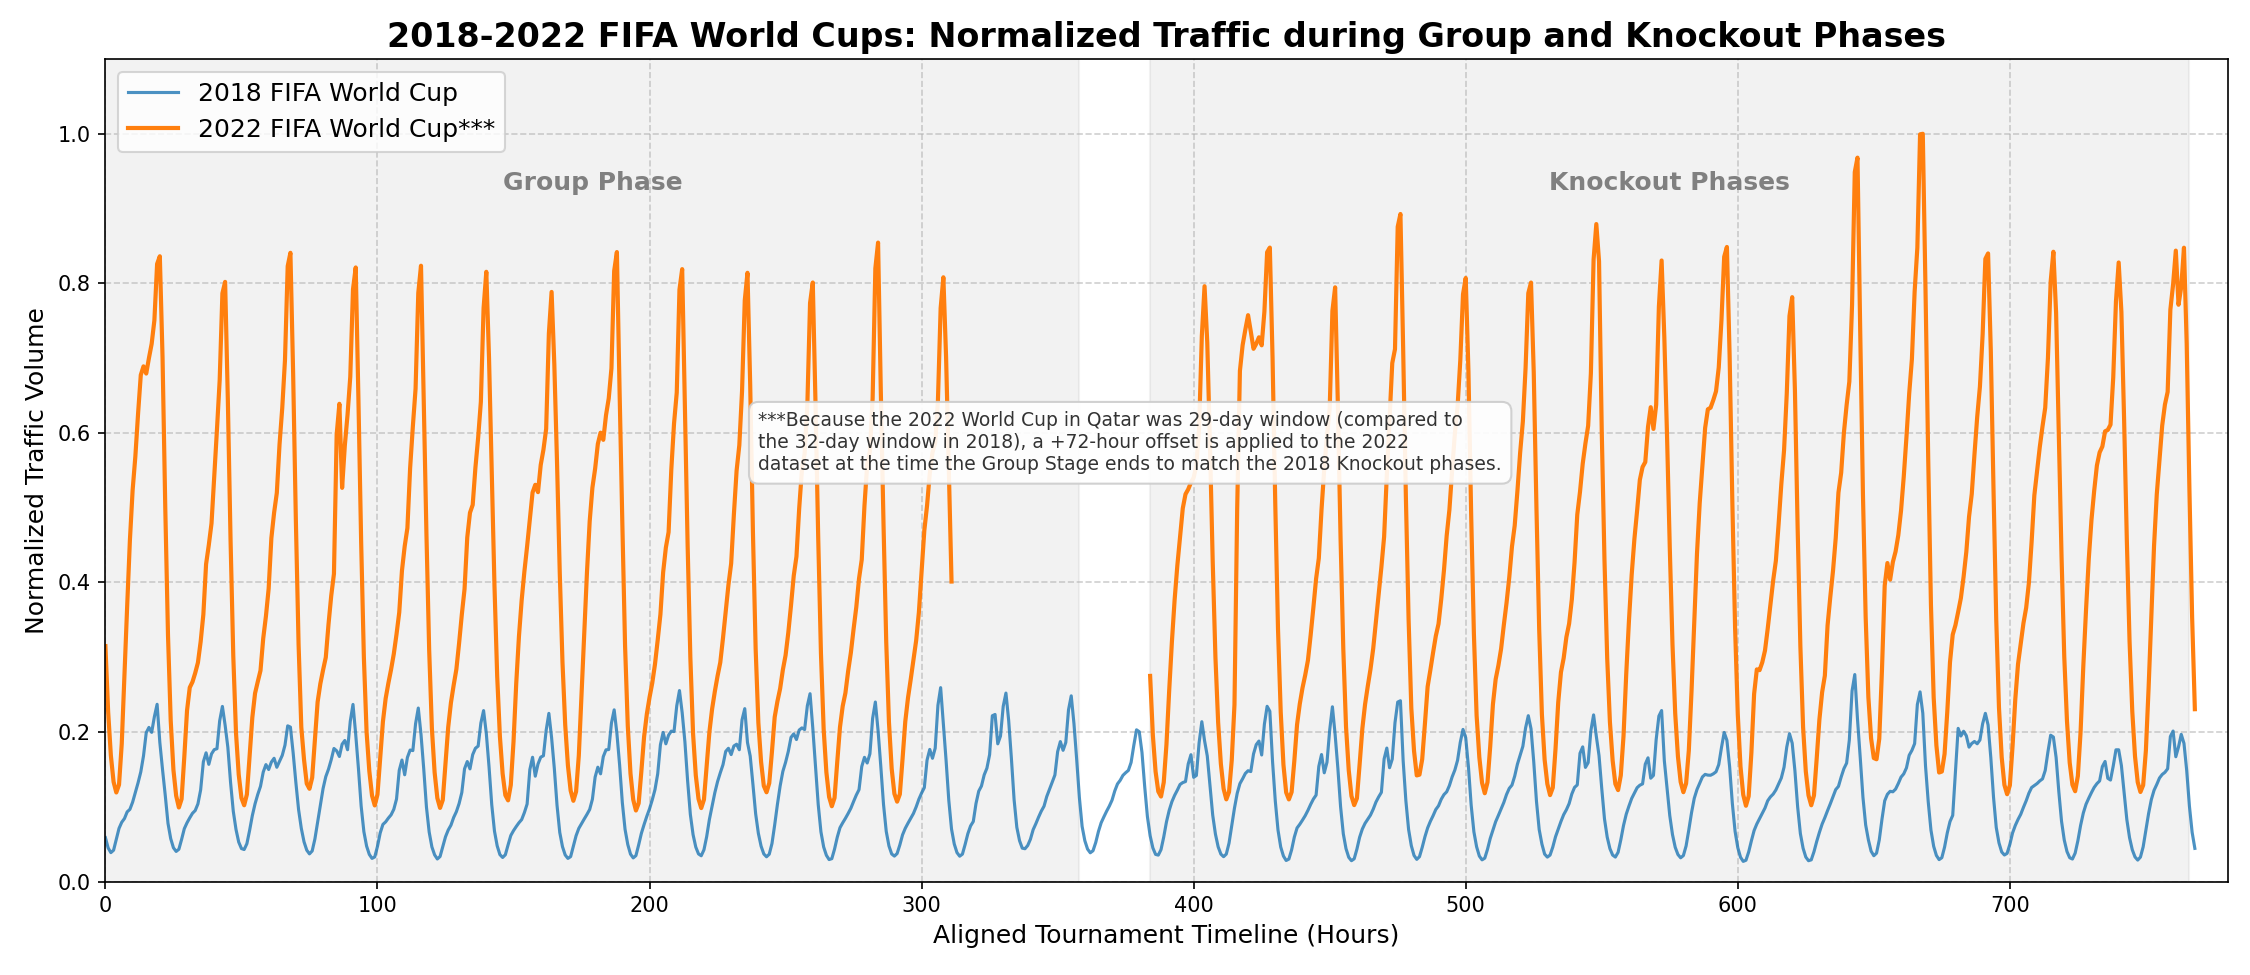
During the 2018 FIFA World Cup, the streaming landscape was strong but still behind linear television. Looking at the traffic distribution on the comparison figure below, the highest ingress traffic reached roughly 0.28 on our normalized scale.

By the 2022 FIFA World Cup, viewer behavior changed completely as most people switched to a unicast OTT (Over-The-Top) streaming-first consumption model. This required networks to send millions of heavy/individual video streams at the exact same time instead of broadcasting one single signal to everyone. This behavior change caused peak streaming volume to grow by about 3.6 times, generating higher and longer peak demand periods, especially during the knockout phases.
Capturing and making sense of this magnitude of data requires a highly optimized backend. As we have explored in our discussions on BENOCS paired with your current network analytics for a high-performing network, a highly optimized data model is critical to make queries zippy, history accessible, the overview holistic, and hardware affordable. This is where overcoming today’s network visibility limits becomes crucial. By utilizing BENOCS fine-resolution retrospection on raw data, networks can easily detect historic patterns, apply predictive analytics, and manage these huge traffic spikes on the fly.
The Anatomy of a Knockout Spike
While the group phase involves weeks of continuous network traffic, the knockout stages represent the true stress test. As teams are eliminated and tension rises, casual viewers gather to witness the “all or nothing” moments. To visualize this escalation, we isolated the knockout phases of both FIFA World Cups and placed the round of 16, quarter-finals, semi-finals, and the final on a shared relative timeline.

Looking at the overlapping timelines, some interesting network behavior patterns emerge:
- The Climax Progression: Notice the steady upward trajectory. By the time the semi-finals arrive, each tournament hits its absolute maximum ingress peak: reaching 0.28 on our relative scale in 2018, and defining the 1.0 ceiling in 2022.
- Semi-Finals are on Weekdays: Historically, World Cup semi-finals are played on Tuesday and Wednesday evenings. During the workweek, viewing is highly fragmented. People are finishing work, commuting, or watching on secondary devices like laptops and smartphones. This fragmented viewing is exactly why the semi-finals generate the peak traffic in both World Cups: millions of individual, heavy unicast video streams hit the ISP backbone simultaneously.
- The Sunday Final Drop-off: Contrary to expectations, the highest streaming traffic does not occur during the final. World Cup finals are traditionally scheduled on Sunday afternoons or early evenings and often see people gathering in large groups at homes, pubs, or public viewing areas to watch the match on large screens. Those screens frequently default to traditional linear broadcast TV, which significantly reduces the load on the OTT streaming backbone.
- The Scale of Change: If you look at the blue line, the traffic for the 2018 World Cup final did not even reach 0.25. Just four years later (Qatar 2022), the first day of the round of 16 generated more than three times as much data as that 2018 final.
Deconstructing the Peak: The Multi-CDN Architecture
When millions of viewers hit ‘play’ at the same time, the incoming traffic to an ISP network becomes a major engineering challenge. Surviving this level of traffic requires a smart, multi-layered delivery strategy.
By analyzing the normalized ingress flow telemetry from the 2022 FIFA World Cup, we can examine how the traffic was balanced. To protect proprietary details, we have anonymized the primary public delivery networks into generic buckets (CDN-01 through CDN-04).

The stacked area chart shows that these huge traffic spikes are not coming from just one single network. Instead, they are supported by a carefully balanced ecosystem, where every level shows unique traffic behavior:
- CDN-01 (top blue layer): This provider consistently handles the largest volume of traffic. It scales quickly to handle the brute force of millions of video streams, protecting deeper network links from crashing.
- CDN-02 (red layer): This provider scales almost perfectly in sync with CDN-01. When CDN-01 fills up during major matches, traffic managers route the extra traffic through CDN-02 to keep things stable.
- CDN-03 (black layer): This is the network that handles the “extra” work. Instead of just carrying the video feed, it is designed to also manage localized content, format optimization, and ad insertion.
- CDN-04 (orange layer): Highly stable and consistent. It uses built-in network caching to deliver content directly to users, completely bypassing public internet congestion.
- IP Transit & Others (gray layer): The base internet routing layer. It stays essential, but data shows that upper CDN layers successfully capture and handle almost all heavy traffic spikes.
Looking to 2026 FIFA World Cup: Extending Visibility to the Application Layer
The significant time zone changes for the 2026 tournament, hosted by Mexico, Canada, and the United States, will require different capacity planning strategies, resulting in peak traffic occurring in the middle of the European night. Fortunately, by leveraging the BENOCS Application Identifier implemented a few years ago, we can now extend our traffic analysis beyond the transport level and directly into the Application layer.
Stay tuned for Part 2 of this series, where we will dive deeper into how this application-aware visibility is essential for effective troubleshooting, informed resource management, and a better understanding of the service-driven trends of major events like the current FIFA World Cup.