Our customers, some belonging to the biggest telecommunications providers in the world, need to monitor and analyze huge amounts of traffic. For this reason, Flow Analytics needs a substantial databank behind it. There is no shortage of database management systems on the market, which means we had to do a lot of testing, before deciding on which one would make BENOCS Flow Analytics work.
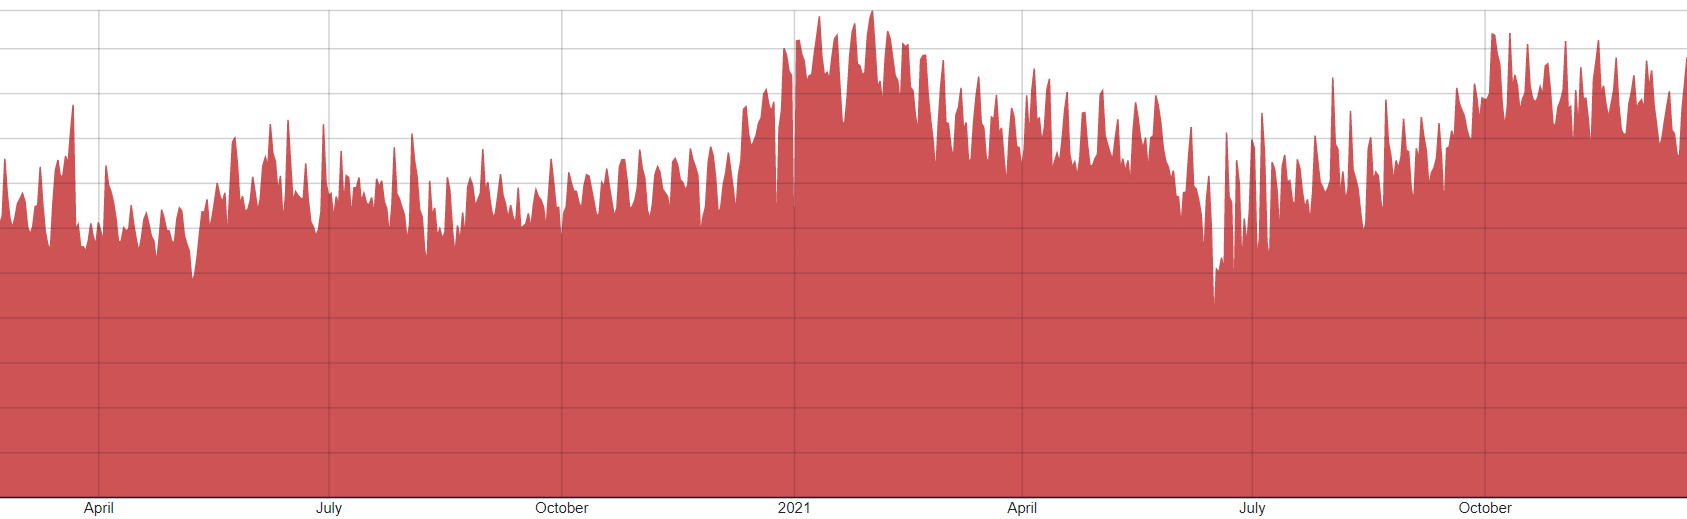
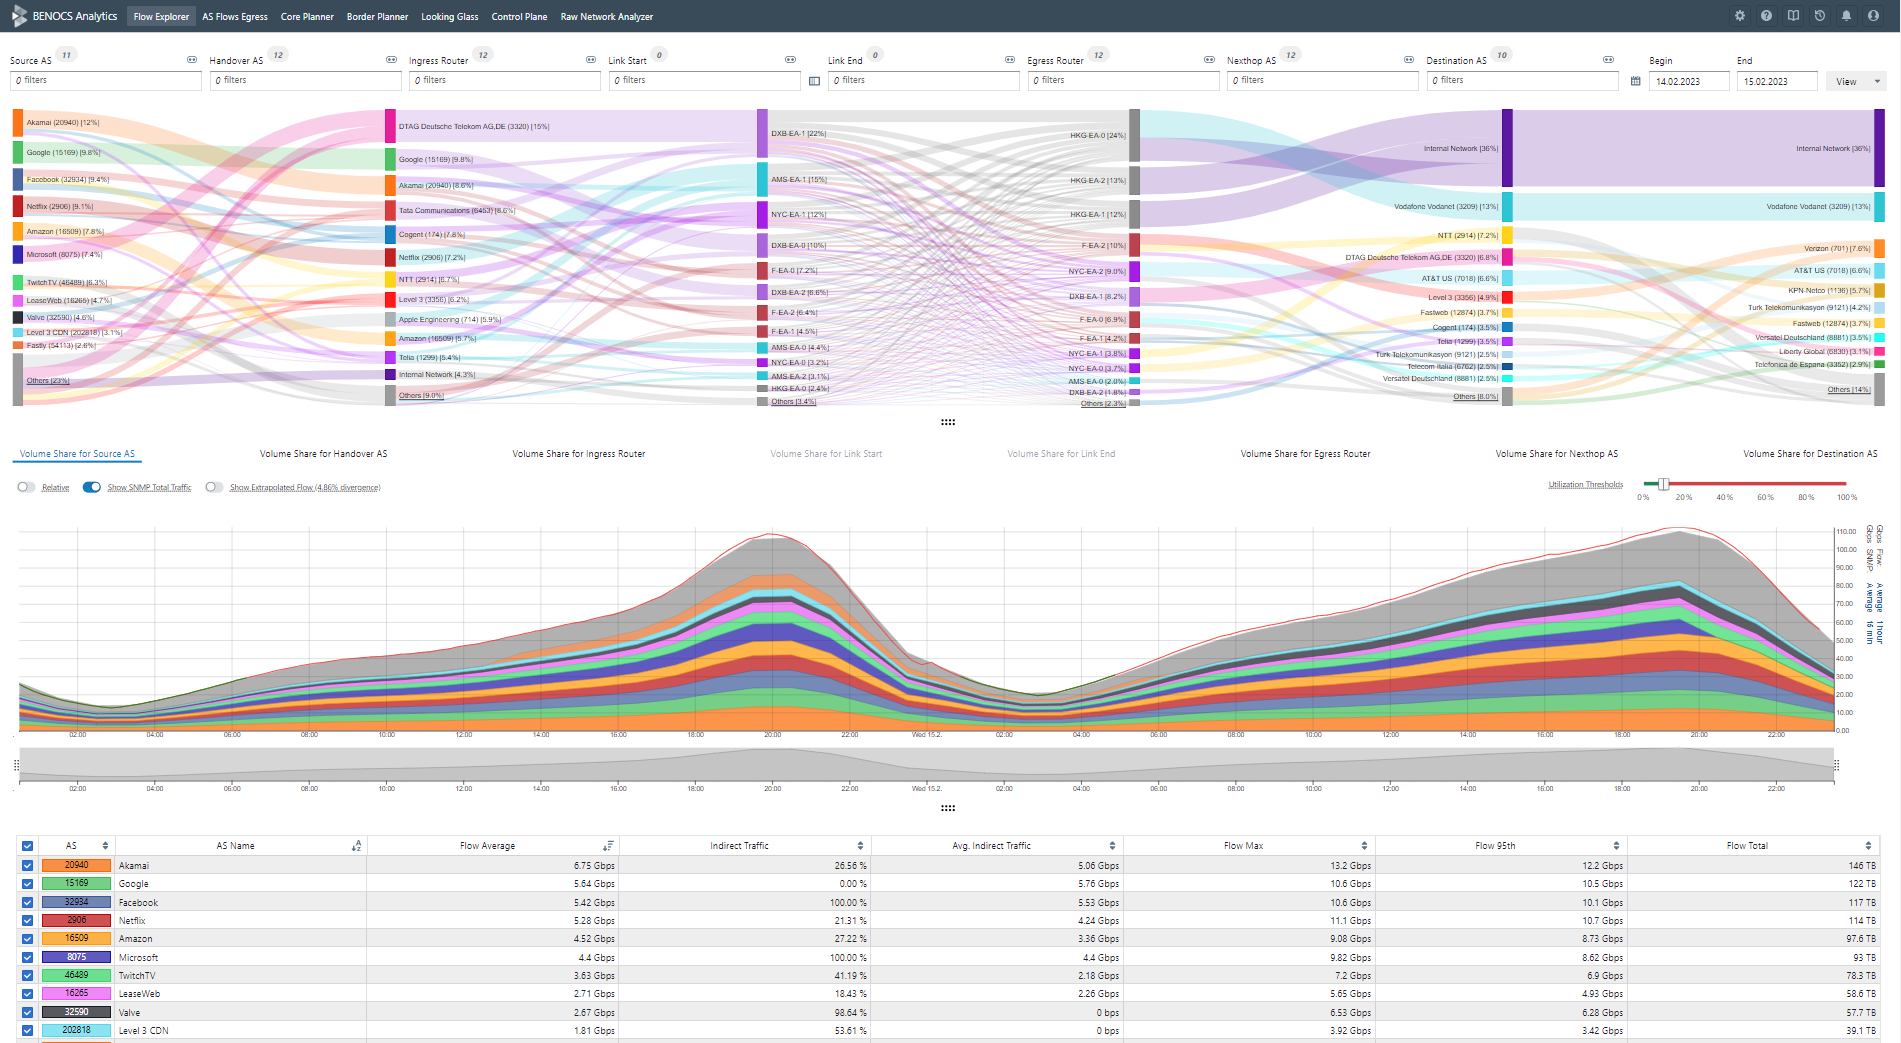
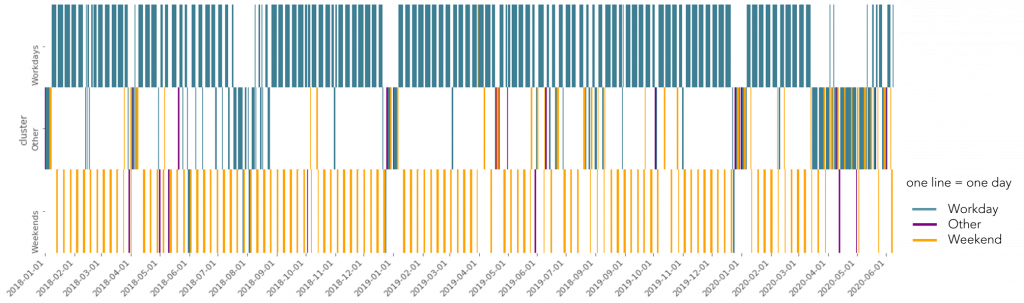
While the internet is home to massive amounts of data, this data is not static, but rather hurtling through cyberspace like William Shatner on a rocket joyride into space. And there’s not just one William Shatner taking a 10-minute trip: There are countless data transfers happening all the time. This movement means we need to factor in another dimension: time. BENOCS Flow Analytics users need to investigate incidents that occurred in specific time frames, making fast access to specific time ranges while ignoring the rest of the data a basic requirement.
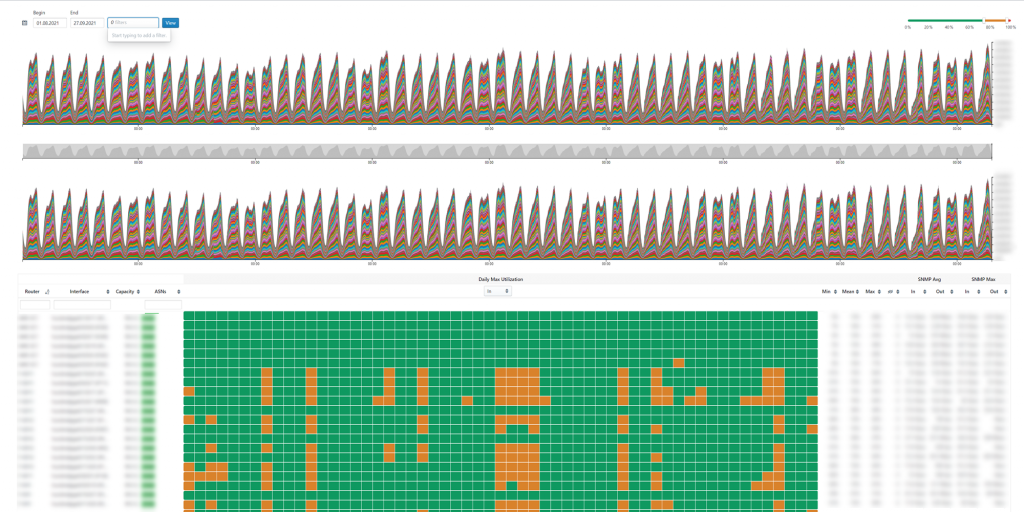
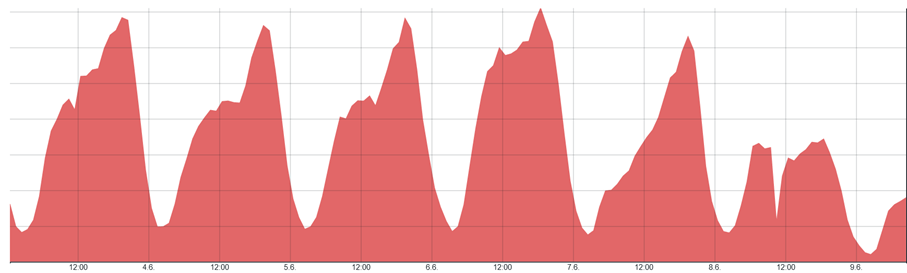
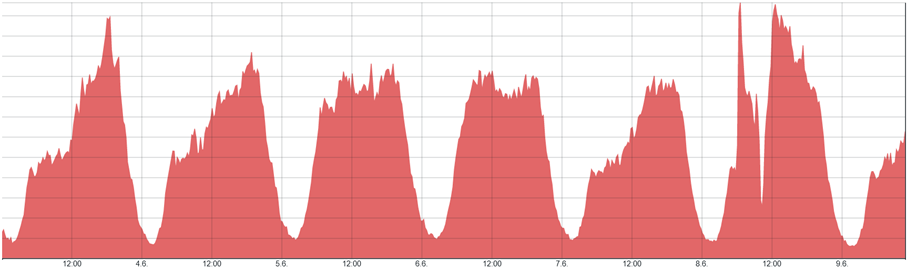
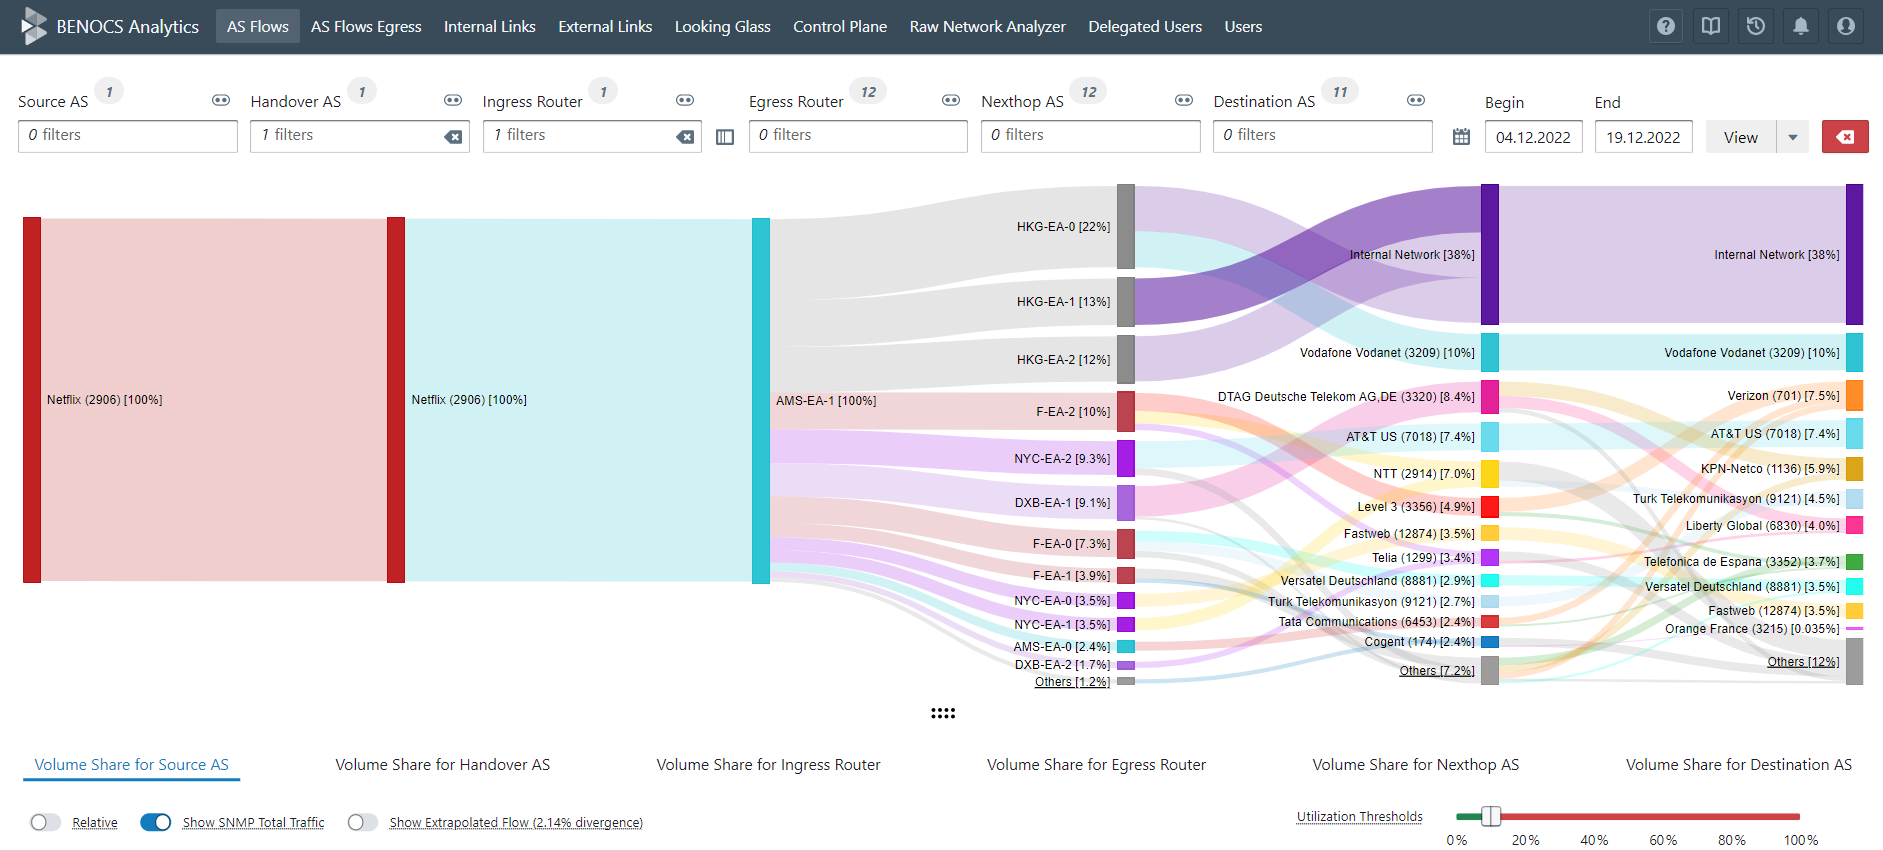
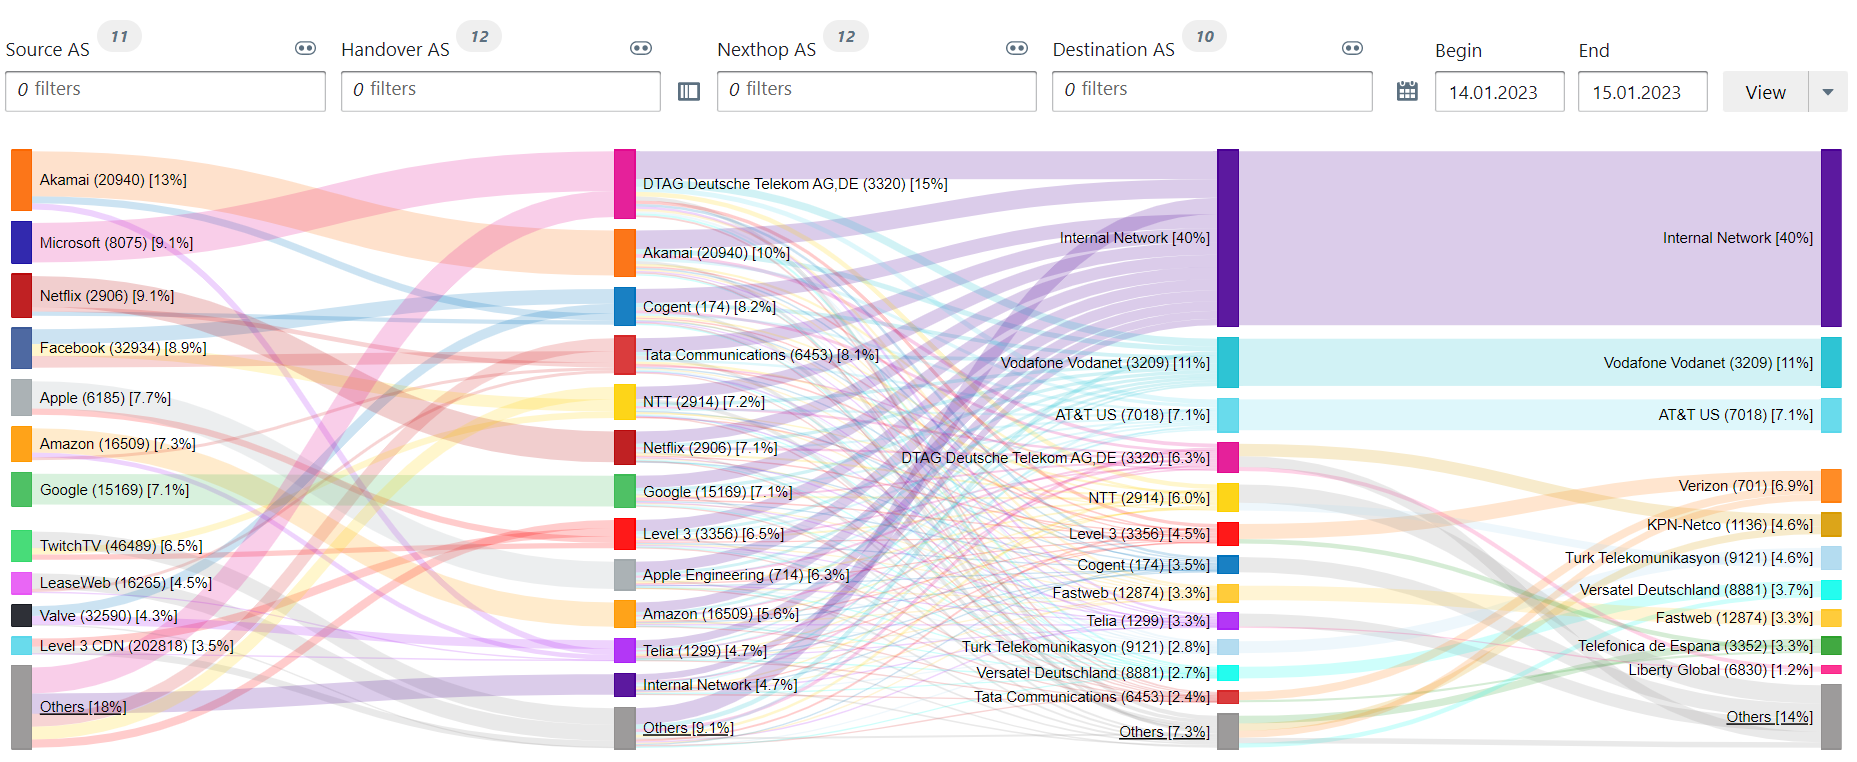
To visualize network traffic in this way we need to measure traffic volume over time, showing the user how the data is behaving on its journey from its origin to its final destination.
Self-healing push architecture
Analyzing network traffic at high complexity and speeds is challenging, especially in diverse environments with asynchronous data feeds. However, we love a challenge and this is the setup that BENOCS operates and has to deal with. Across different network setups, BENOCS unifies the data sources and correlates the incoming network information.
At BENOCS, we process and correlate data feeds of dozens of terabytes each day. The data processing is built around data becoming available from different sources, then being pushed through several jobs. This essentially becomes a data push architecture that processes data as it becomes available.
In the above scenario, three data feeds are producing three results that are of different data types. Furthermore, each of the individual feeds has its own time resolution as well as delay when the data should be available – however, sometimes it’s late. In the case of data being late, processing should not stop, but rather skip the late pieces until they become available. Once available, they must be made available as well.
So why ClickHouse?
At BENOCS, we chose to build this architecture with ClickHouse at its core for several reasons. In summary, those are fast indexing and fuzzy matching on data streams.
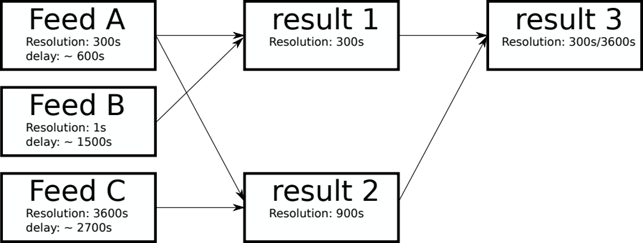
Let’s consider result 2 as an example. This can only be processed when Feeds A/C have data. However, it is possible to partially process data in case data from Feed A is missing. In numbers this means if Feed A has data for 10 5-minute timestamps for a specific hour ready and Feed C has a matching timestamp for that same hour, at least two of the four timestamps in result 2 can be calculated. The other two timestamps need to wait until Feed A makes the data for it available.
ClickHouse solves this problem for BENOCS by fast lookups on the time dimension. By running DISTINCT SELECT queries on the primary indexing column, terabytes of data can be searched through in a matter of seconds. This makes the operation of checking the data availability light-weight despite the heavy data burden.
However, searching through the timestamps and finding gaps efficiently is not all. The same principle also applies for the actual data processing correlation. ClickHouse’s ability to skip data based on time makes the table sizes become almost irrelevant, as it can zoom in on the needed data efficiently. This makes the processing time for a single time range independent of the actual table size as well as the position in the data. This ClickHouse mechanism allows BENOCS to run efficient self-healing data streams in the face of unreliable data streams.
Fast indexing
Fast indexing is the most important reason BENOCS heavily utilizes ClickHouse. It boils down to ClickHouse offering extremely fast lookups on specific dimensions due to its MergeTree table design. ClickHouse allows for skipping vast amounts of data in a matter of seconds based on the primary key without having to consider the data in irrelevant data at all.
For BENOCS, this dimension is time. In the ClickHouse pipeline we run, lookups based upon time are the first step towards any job being scheduled.
Fuzzy matching
When dealing with different time scales, joining tables usually means unifying the matching columns to have exact matches. However, when dealing with vastly different timescales (see Feed B/C), this becomes highly complicated as FEED B might have multiple different matches for one key in Feed C. Furthermore, other dimensions complicate things due to missing/incomplete data.
This is where the ASOF join of ClickHouse comes to the rescue for BENOCS. This means being able to find the nearest match instead of the exact match using a join. Combined with well selected WHERE clauses this becomes a powerful feature that expediates and simplifies queries massively.
Summary
BENOCS processes vast amounts of data in ClickHouse, utilizing its powerful engine. The ability to zero in on the needed data and being able to ignore irrelevant data lets BENOCS build a self-healing data pipeline that can handle unreliable and volatile data feeds into a stable analysis for its customers.
If you’re a telco provider wanting to optimize your network traffic, drop us a line and register for a free Demolytics account to see BENOCS Flow Analytics in action.
This blog post originally appeared on clickhouse.com.