BENOCS Flow Analytics

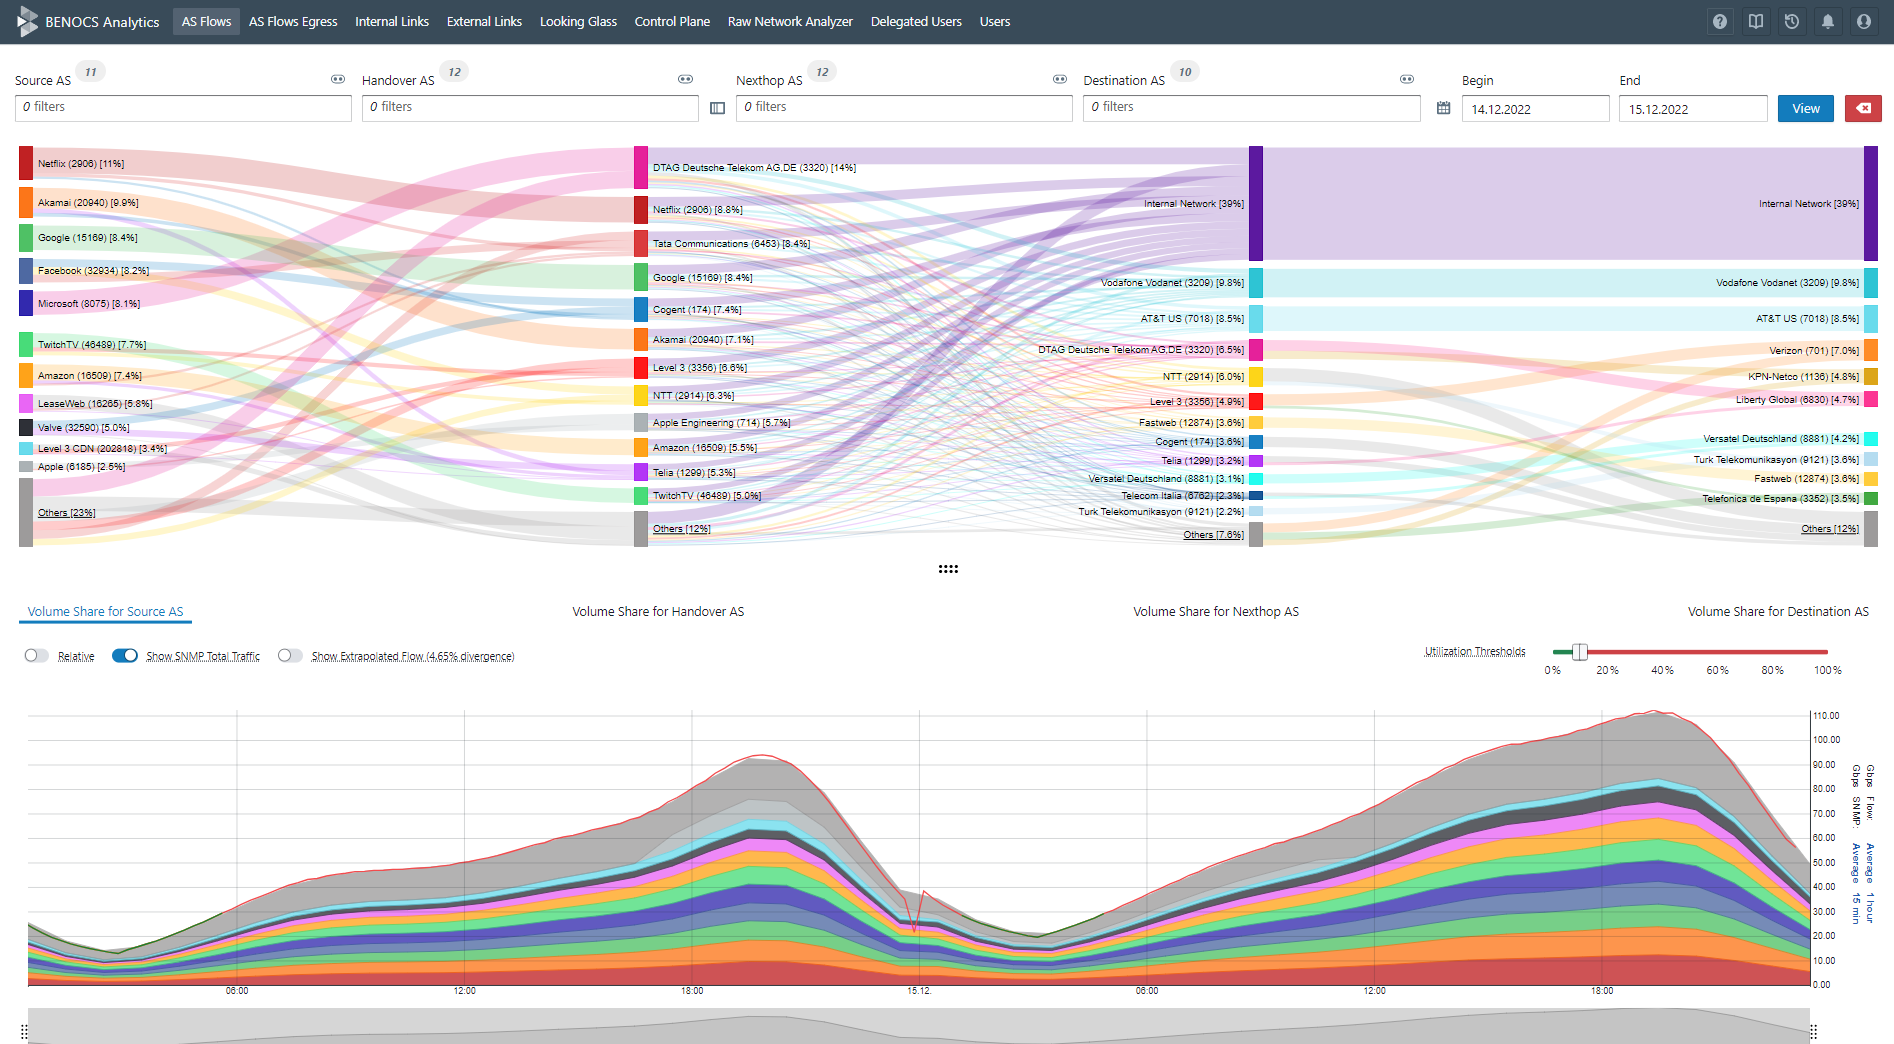
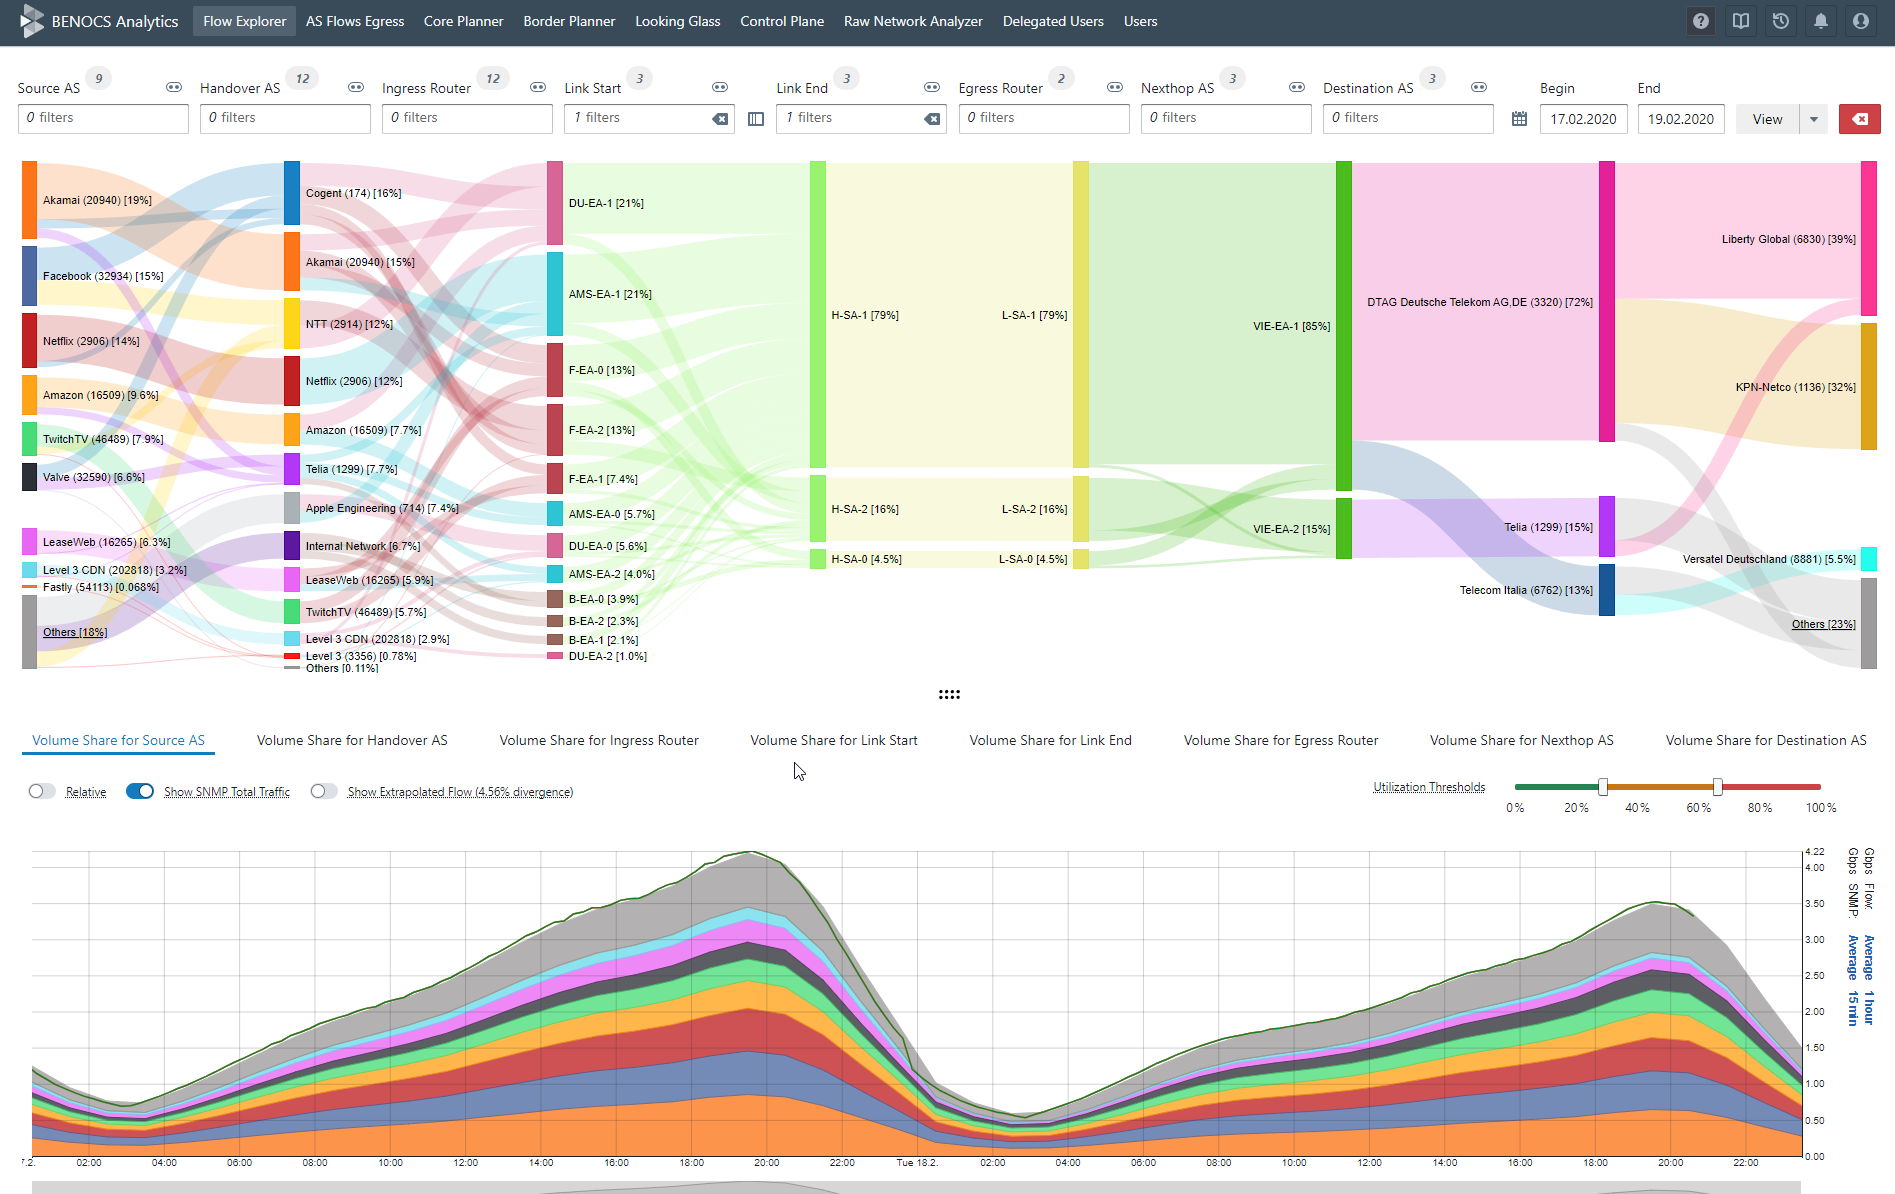
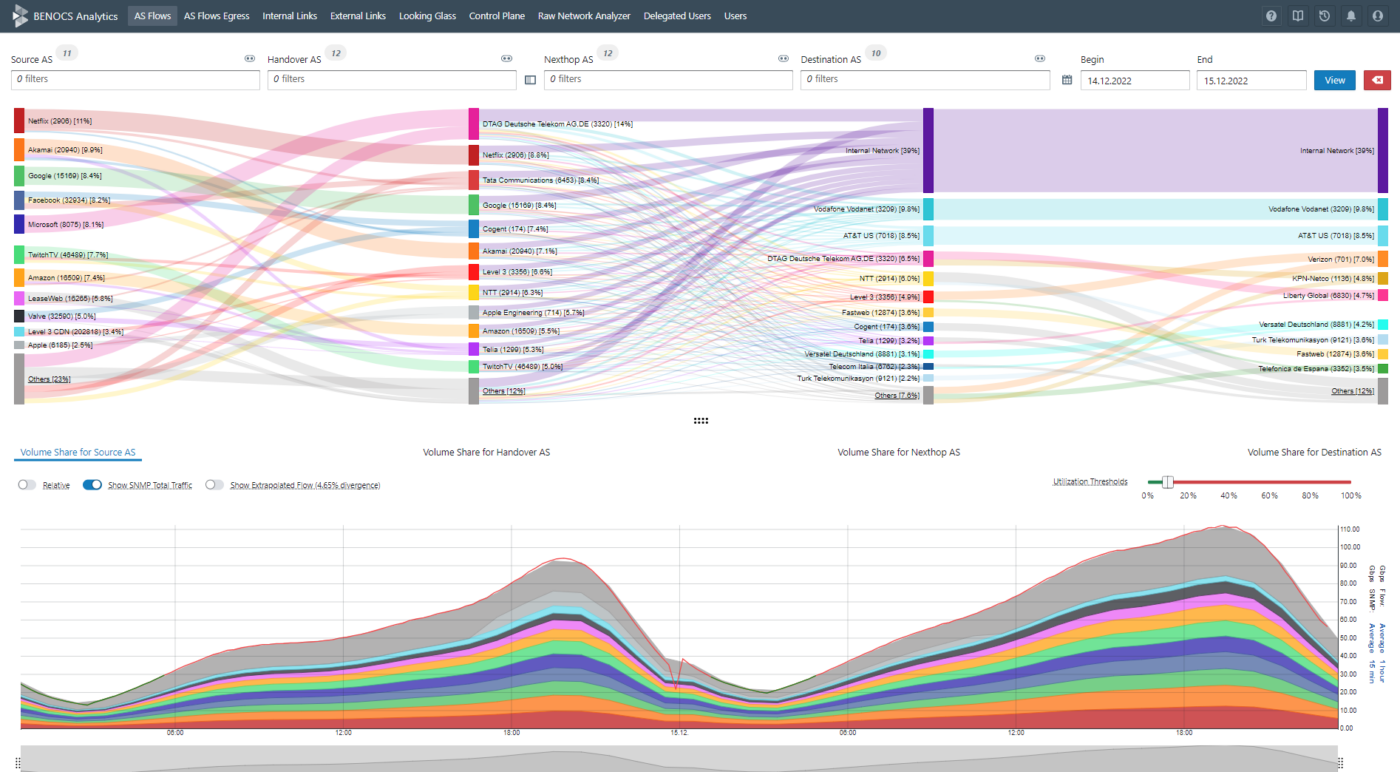
Screenshot BENOCS Flow Analytics

BENOCS Flow Analytics helps you solve network visibility challenges by letting you inspect traffic flows in their entirety. This means from source to destination and includes how traffic enters, traverses and exits the network backbone. Using a ‘top down’ approach, you gain a holistic view of your traffic across multiple dimensions to find and react to traffic anomalies fast, or identify new business opportunities in just a few clicks. The intuitive flow-based model makes it easy to share network information with your colleagues, regardless of their role or background.

We believe knowing your network should not be limited to those with a technical background. Instead, it should be available to and understood by all. From technicians configuring BGP sessions to commercial sales managers, everyone should know their network traffic and be aware of the impact of their business decisions.

Who is BENOCS Flow Analytics for

BENOCS Flow Analytics is built for

who want to provide their customers with the best quality of service without failures or delays, while optimizing their interconnections like transit and peering.

With network analytics, you can find new customers, prevent network failures, locate incidents, analyze traffic level utilization, and find answers to questions you didn’t even know you had. Therefore, providing your customers with the best possible service while saving you valuable time and resources.

Developed from a network-operator perspective, BENOCS Flow Analytics lets you deep dive into your network in just a few clicks, enabling you to make on-the-fly traffic decisions in real-time. Using straightforward terminology, we make cross-departmental communication on network traffic easier than ever before.

BENOCS Flow Analytics makes it easy for network operations teams, engineers, planners and quality assurance departments to

  • track network performance
  • troubleshoot fast
  • see the best time to upgrade

Using the same tool, wholesale and peering managers can

  • find new partners
  • seek new business opportunities
  • strengthen customer relationships
  • reduce transit costs
  • maximize tranist revenues
  • strengthen customer relationships

Take a look at some use cases here.

Want to try out BENOCS Flow Analytics?

Flow Analytics is offered as a SaaS product and the pricing for each customer is determined by the following information

  • peak traffic on the network
  • no. of BGP speaking routers that export flow data
  • total number of routers
  • no. of BGP- private peers (transit, peers, caches, CDNs and customers)
  • flow sampling rate

Once the above info is provided, our sales team will come back to you with customized pricing for various bundles. There are four pricing components in BENOCS Analytics. The table below explains the different fees and the services included. Should you have any questions at all, reach out to our sales team, who will be happy to help you!

Fee Services included When applicable?
Service Fee Software, updates, maintenance of VM’s software, training, onboarding, customer support, data quality assurance Default
Traffic Fee All the services mentioned above for additional traffic usually charged every 100 Gbps/ 1 Tbps steps Traffic goes above committed peak traffic
Hosting Fee Hosting the entire stack of software in Benocs data center located at Digital Realty in Frankfurt If you choose BENOCS Hosting
Setup Fee Deploying Analytics in your network and all the services up till Onboarding If the contract term <= 2 years

Below you can see which modules are included in the silver and in the gold bundles.

Modules Protocols required
( Flow & BGP mandatory for all)
Silver Gold
Flow Explorer ./.
Core Planner SNMP, IGP / BGP Linkstate ×
Border Planner SNMP
Customer Portal ./. (Skin CD/CI) ×
SNMP integration (data, graph, auto-scaling) SNMP
Core flow Inspector IGP / BGP Linkstate ×
Looking Glass (internal) ./.
Looking Glass (public) Skin CD/CI ×
Data-Packet XXL (Top200, 5-min…) ./. ×
Application Identifier DNS ×
Raw Network Analyzer (RNA) ./. ×
Anomaly Alerts ./. ×

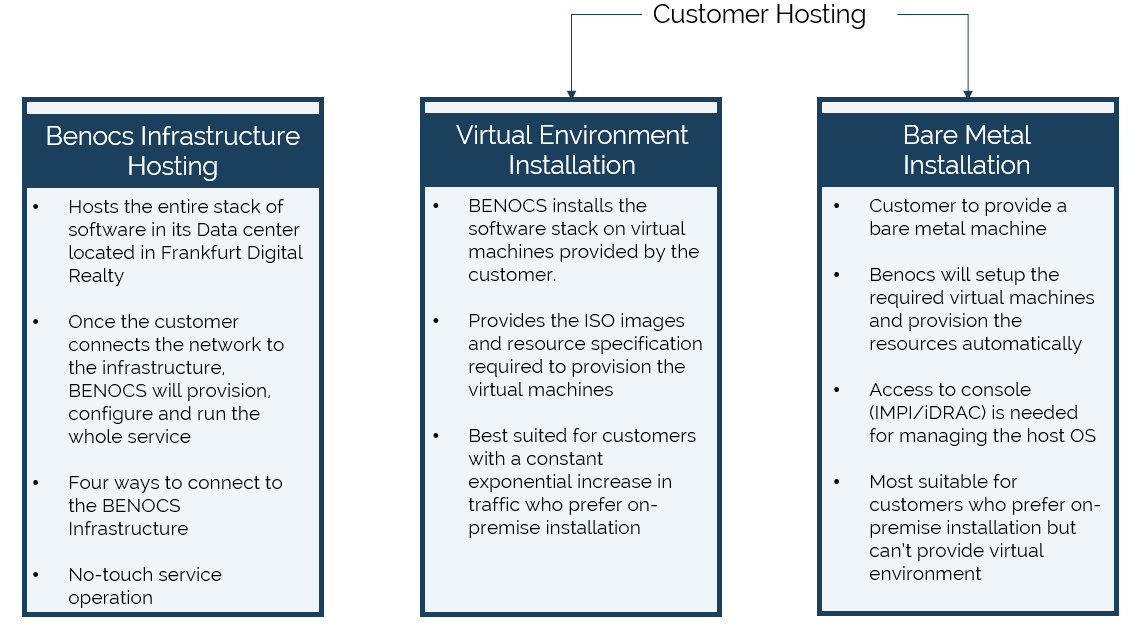
BENOCS offers three types of deployment options based on customer’s requirements and needs:

  • BENOCS hosting
  • Virtual environment installation
  • Bare metal installation
BENOCS Analytics can be installed either in the BENOCS cloud in Frankfurt, Germany, or by the customer (virtual environment or on-premise).

We also offer customized deployment options, depending on your specific needs.
Modules

Flow Explorer

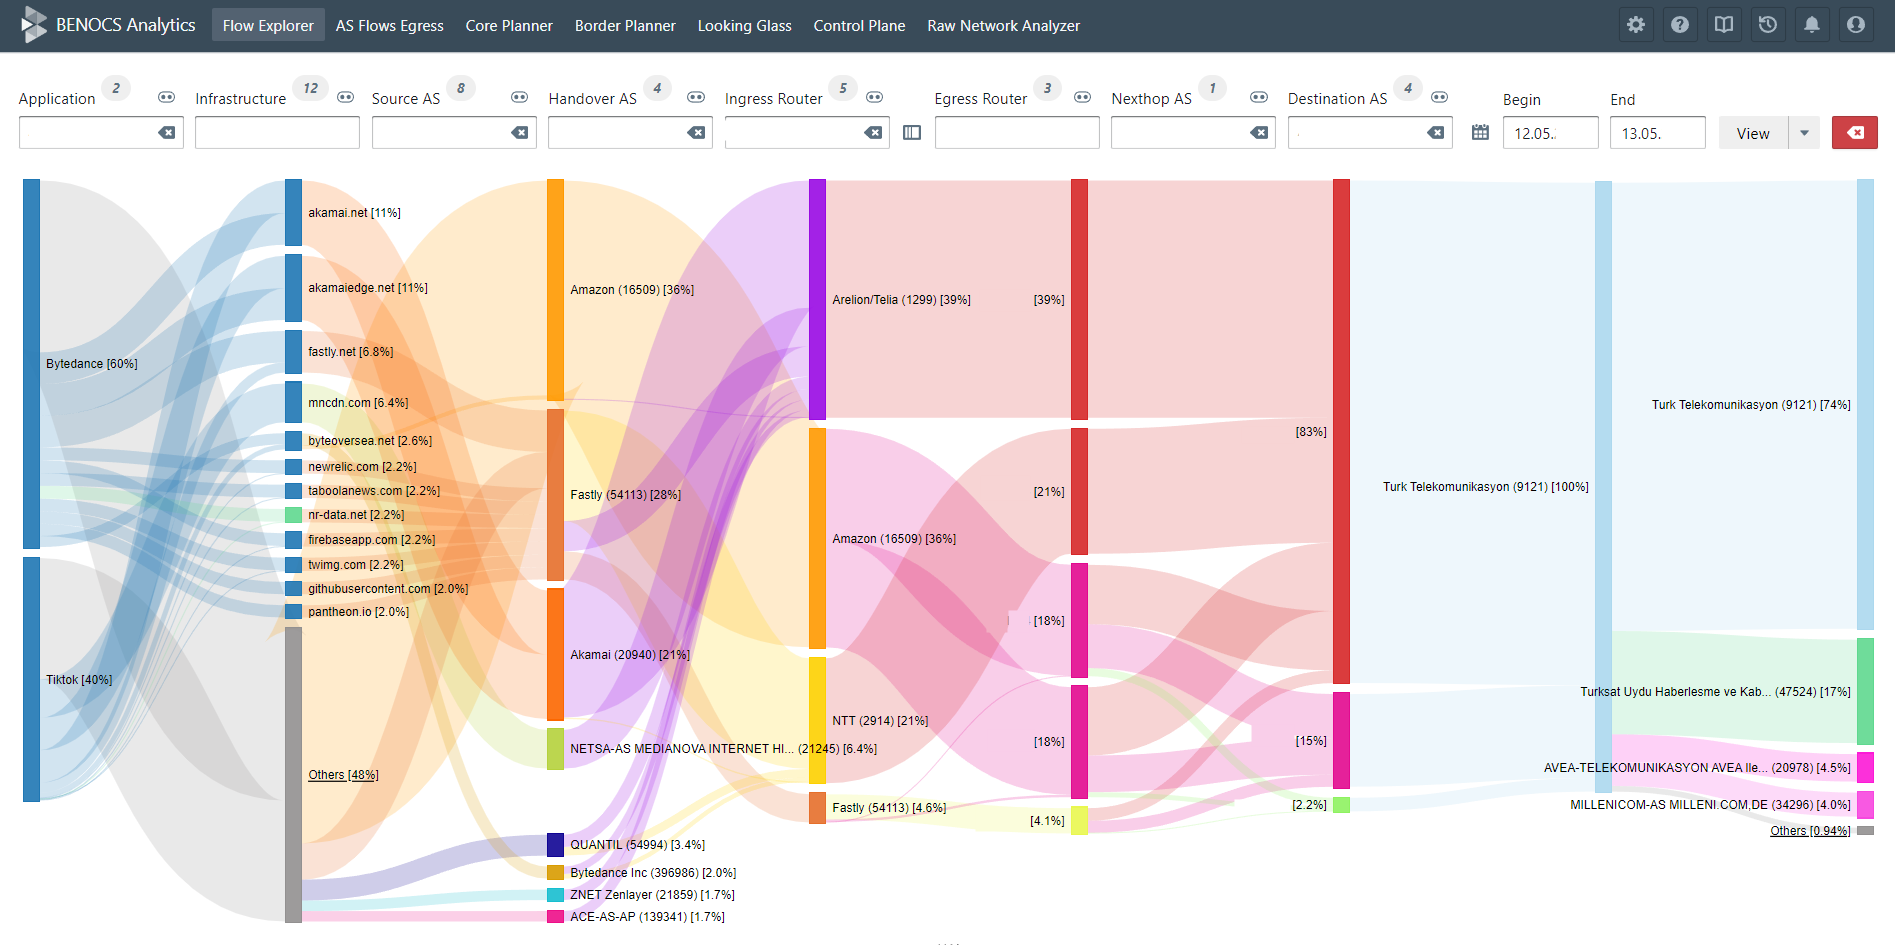
Multi-dimensional traffic inspection on AS level, edge router level, or even core router level enables deep exploration of your network data-plane for troubleshooting and finding new business opportunities. With our high-performance and easy-to-understand sankey, you can learn about your network’s traffic behavior fast. The best part: you don’t need to be an expert to find value in your network.

AS Level: From source to destination, this is the simplest view of traffic flows through the network. This view is ideal for wholesale and peering departments for spotting peering partners, evaluating transit revenue, and lowering upstream costs.

Edge Router Level: An extension of the AS-level view to include ingress and egress (e.g. BNG and LER routers). With this view, network operations and peering departments gain insights into capacity and utilization for build-outs, upgrades and finding new peering locations.  For networks with multiple locations, this allows easy identification of unnecessary large backbone loads due to wrong handovers in remote regions.

Core Router Level: The core router level enables the CSP to take any link in their backbone and look into what is being transported between two core routers, without either of them having to export any flow traffic.

Looking Glass

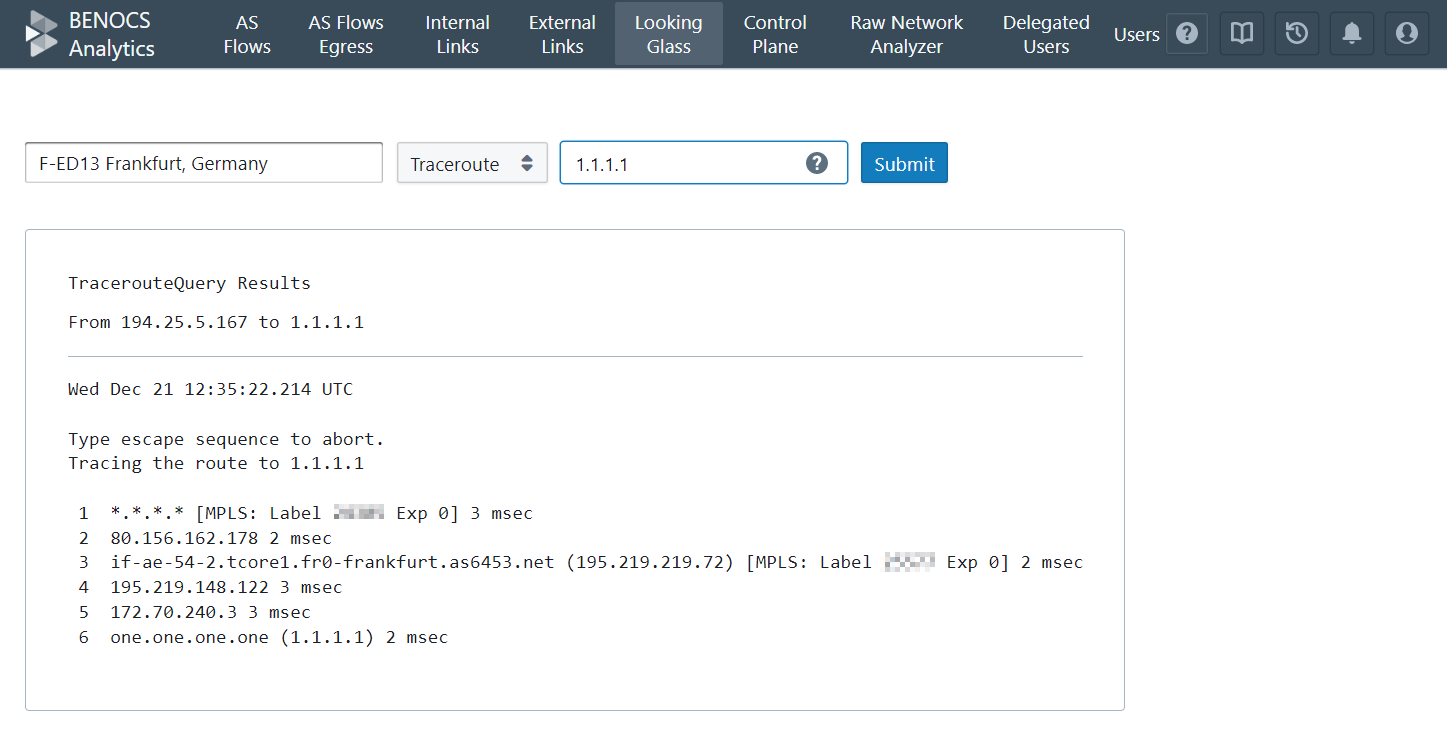
The BENOCS Looking Glass can be made public and/or paired with BENOCS Flow Analytics. It features AS-path, prefix-path, ping and traceroute without hardware deployed at router locations. By pairing with BENOCS Flow Analytics , we track all routes in your network (iBGP and eBGP). Those routes that shouldn’t be visible in the publicly available Looking Glass can easily be removed.

The private version is accessible via tab in the Webapp and behind a secure login, thus can be unrestricted in data output. This can also be made accessible to your transit- and business-customers with our customer portal module.

The public looking glass assigns public, read-only access to your customers who want to test and trial your network’s routing. Export filters can easily be set.

The Looking Glass holds historical snapshots for debugging and forensics. You can also customize it to fit your company brand and image.

Core Planner

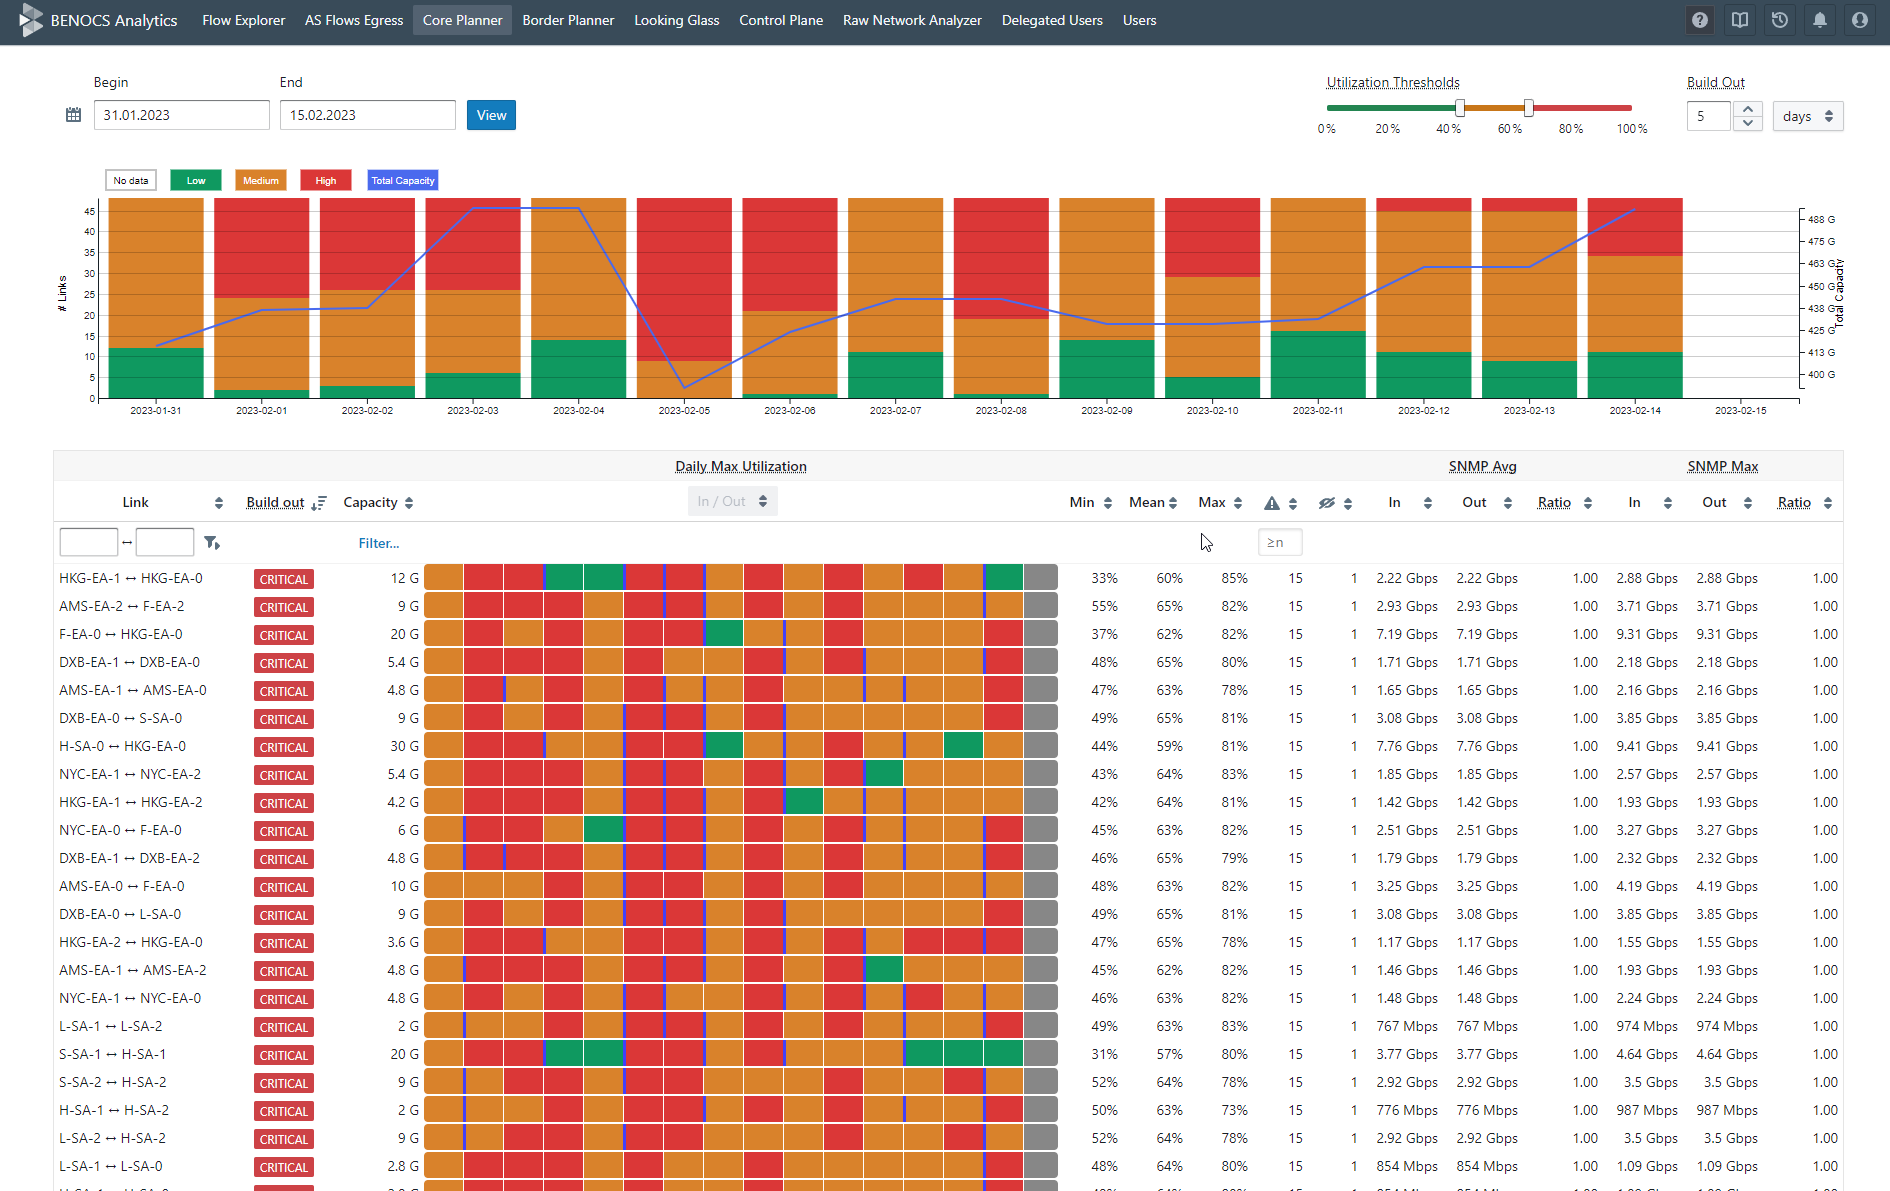
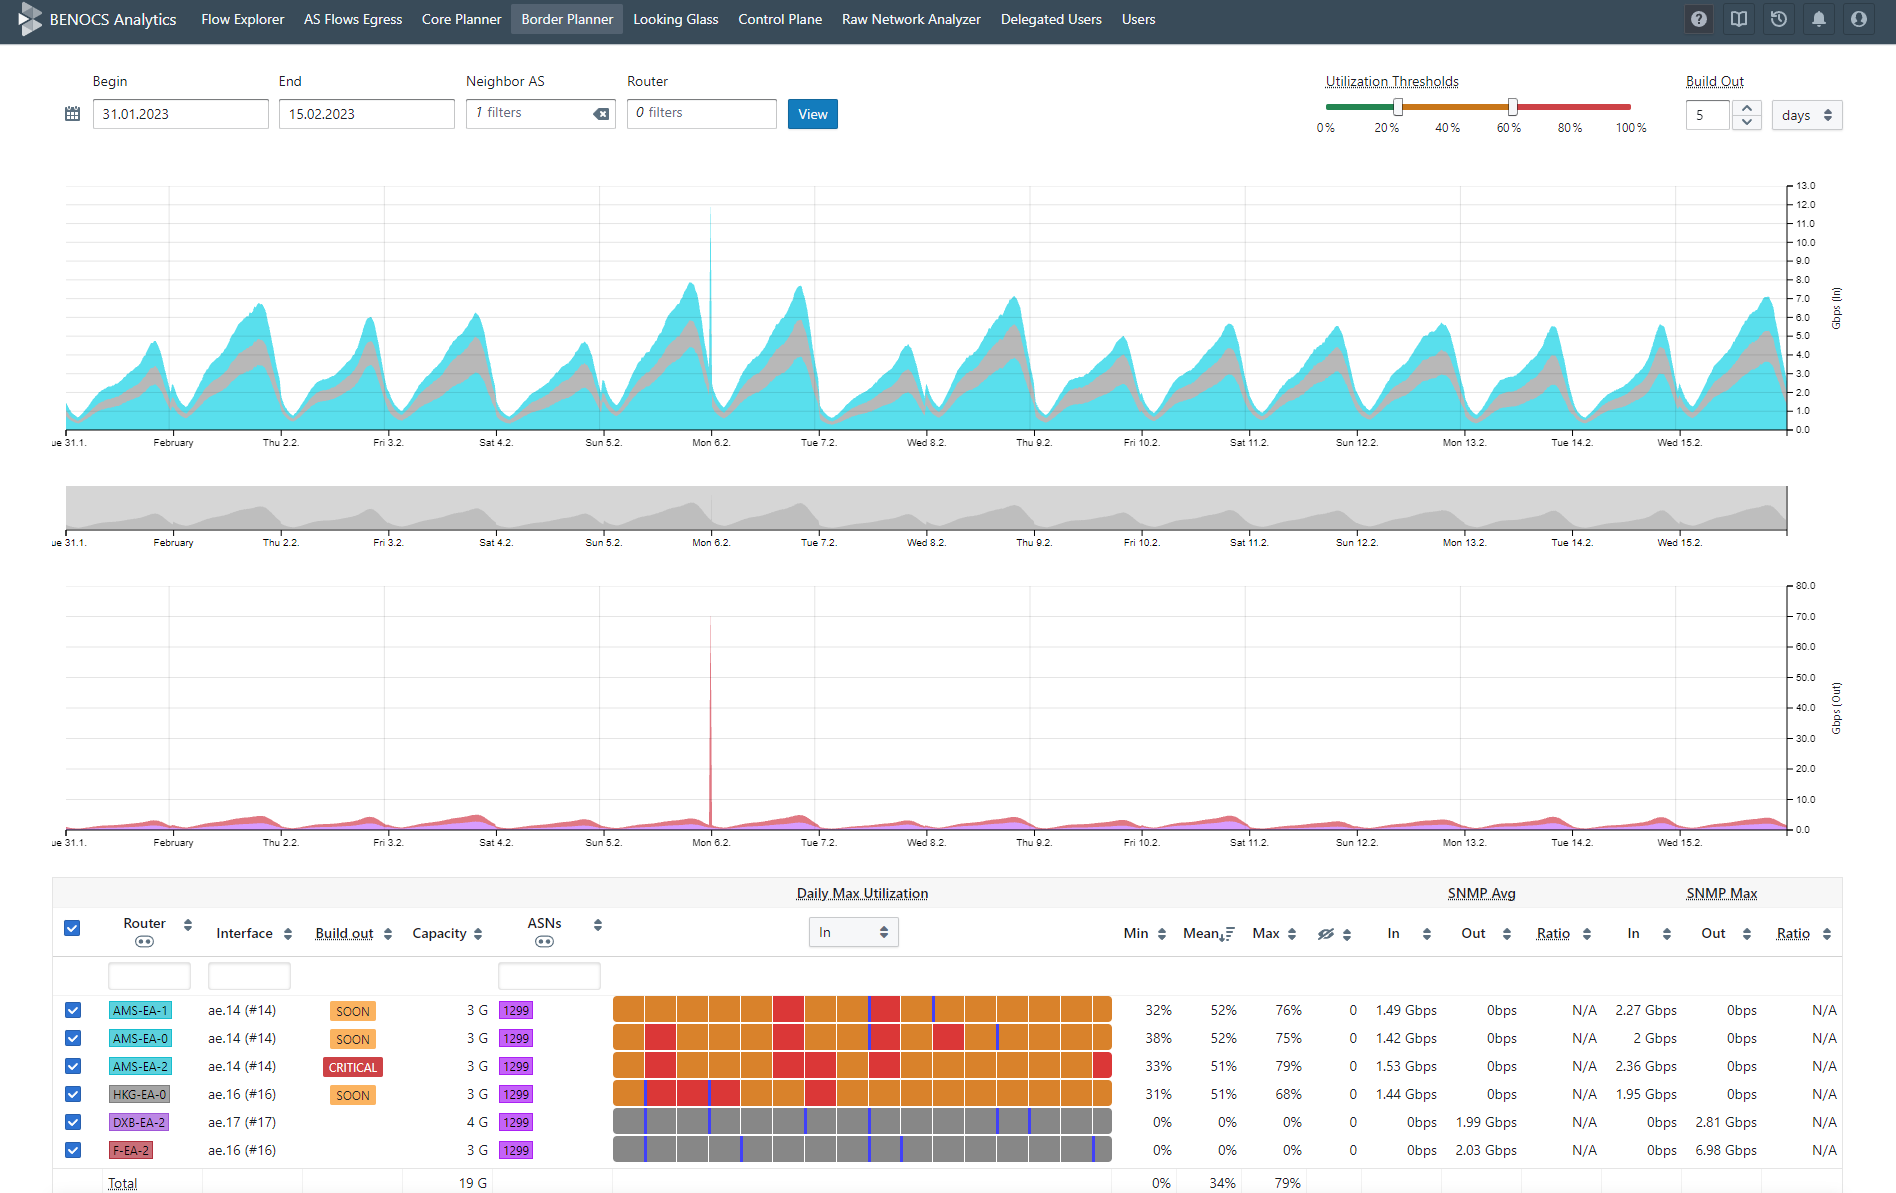
The Core Planner let’s you plan the capacity of your network’s core routers. You can see SNMP-based utilization of all backbone links all on one page, as well as the thermal graphs, which change based on the customizable thresholds. All of this in a click.

The interoperability between Flow Explorer and Core Planner allows you to view the entire path of your traffic from source to destination, filtered for a particular backbone link.

Border Planner

With the Border Planner you can view the capacity and utilization of all the edge routers connected to either your peers, customers, caches or transit providers in a thermal graph controlled by customizable thresholds. You can view the SNMP-based utilization filtered down to a specific neighbor AS or router and split between in and out graphs on a time series.

The interoperability between Flow Explorer and Border Planner allows you to view the entire path of the traffic from source to destination, filtered for a particular router or a neighbor AS.

Customer Portal

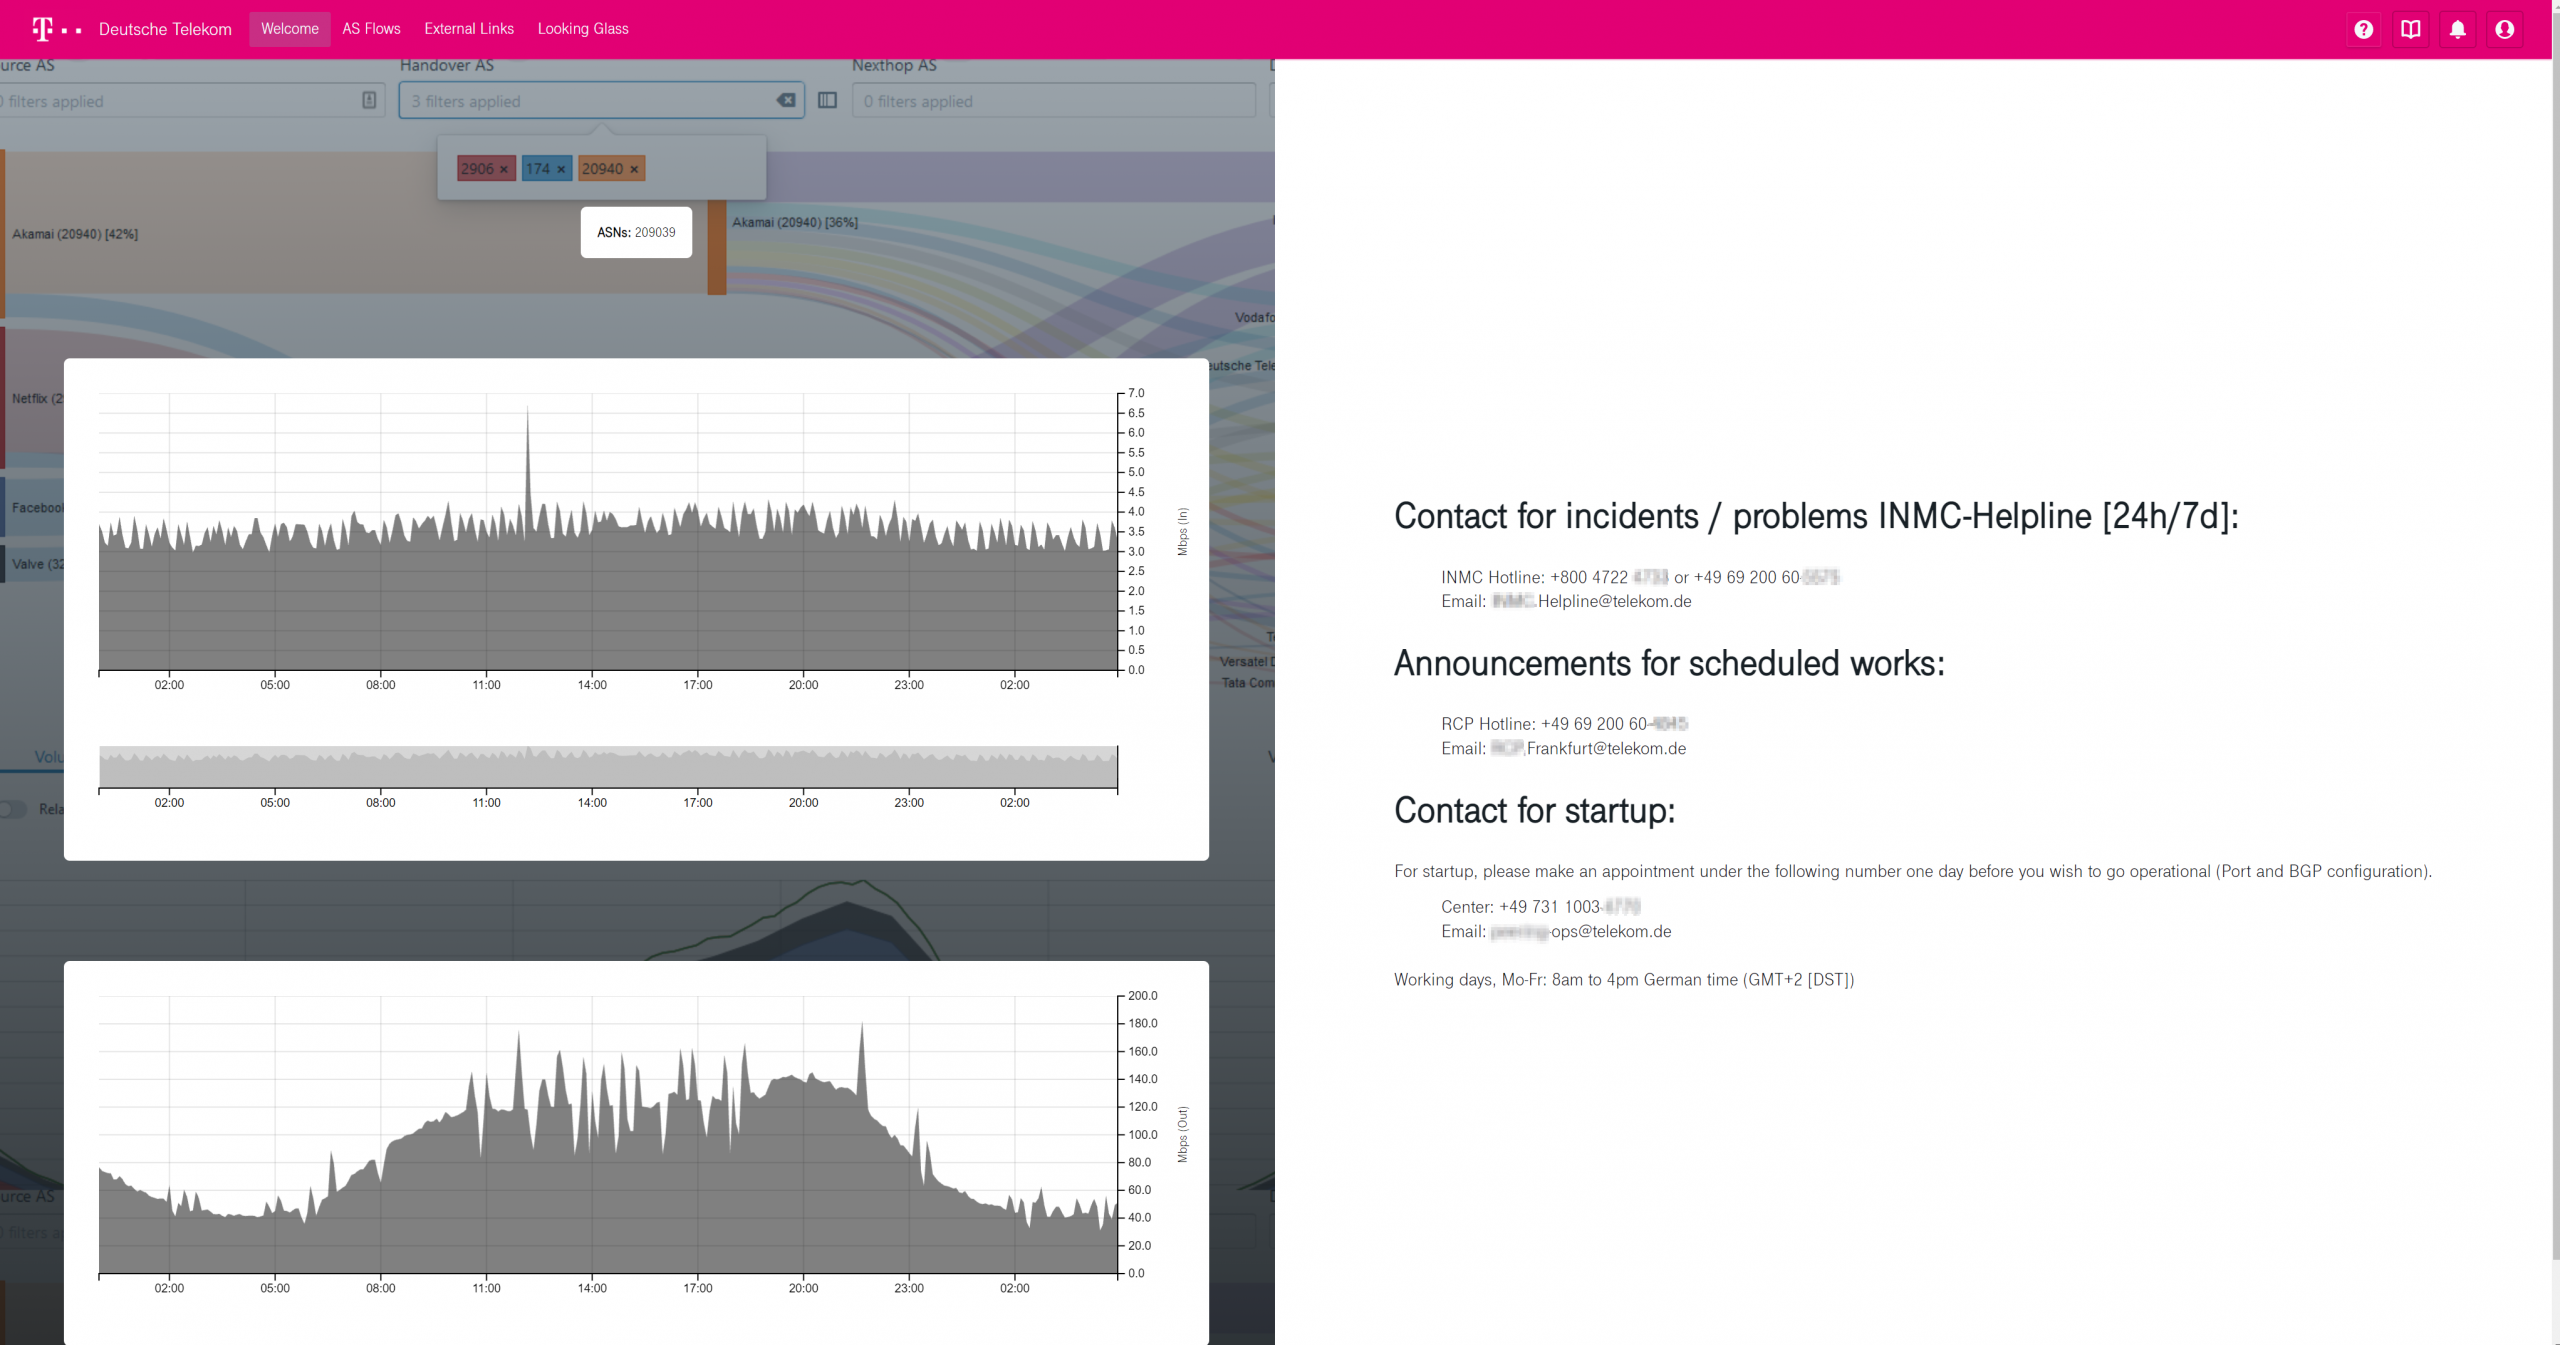
Transparency is fundamental for any good relationship. With the Customer Portal, you can share the parts of your data with your customers that are relevant to them. By doing so, you give them the same understanding of the network as you have, easing trouble shooting and building trust. This is even more compelling for IPX networks, who need to be as transparent as possible to their customers.

The Customer Portal uses information from BENOCS Flow Analytics to create a customized view that allows the customer to see only the interfaces they are connected to on your network. Operators also have the power to select which dimensions will be displayed for each user.

The customer portal is a valuable feature for hosting-companies, wholesale carriers, IPX, commercial and peering departments. You can also customize it to fit your company brand and image

Screenshot BENOCS Analytics - Module - Customer Portal start page

SNMP Integration

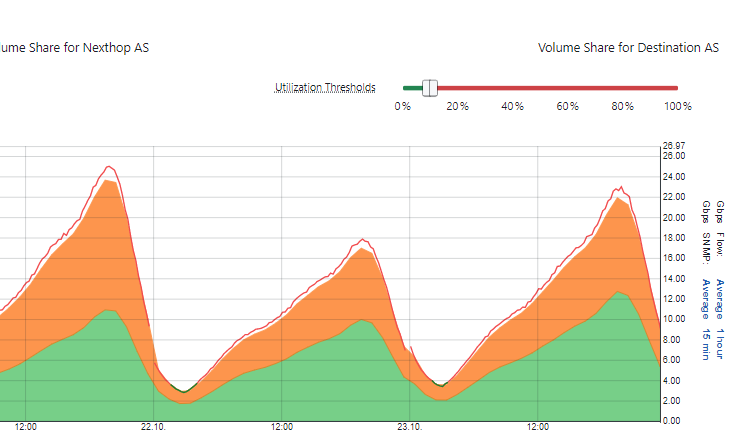
In the early days of the internet, knowing the amount of traffic going through your network via counter protocols such as SNMP was sufficient for estimating its performance. Nowadays, network traffic has grown in such size and diversity that SNMP alone cannot do traffic mix analytics. Instead, many network operators are finding flow data such as from Netflow to be more pivotal when tracking traffic behavior. However, we have learned that by only trusting a statistical data flow (like Netflow) can lead to false and misleading representations of network traffic. That is why we offer the SNMP feature for data cross-correlation, automatically correcting potential sampling errors from flow sources.

BENOCS Flow Analytics computes sampled flow data as its primary source for visualizing flows and cross-correlates it with SNMP protocols to create an accurate and reliable picture of your traffic flows along with the amount of traffic crossing your network. This also enables complex billing models based on traffic-profile parameters (e.g. destination-profiles)

SNMP information is also used to augment capacity and utilization information.

Being able to see the amount of traffic on your network along with the entire source to destination traffic flows is essential for everyone doing network analysis.

Core Flow Inspector

BENOCS’ Core Flow Inspector lets you see traffic for any single backbone link in your network. It displays AS-flows over individual links on your network’s backbone, even if the backbone routers (e.g. LSR’s) don’t export flow information. All traffic dimensions, i.e. source application, source AS , handover AS , nexthop AS , ingress router, egress router and destination AS , are displayed and can be filtered.

Imagine if you could see who is filling your expensive submarine links. Wouldn’t that be awesome?

Application Identifier

BENOCS’ Application Identifier correlates flow and DNS data to let you see exactly where your traffic is originating from. It identifies applications and services within the source AS (e.g., Video, Gaming, OS updates, or OTT traffic) based on CNAME/A-record pairing, and offers centrally edited and customizable tags. In the future, Application Identifier will unlock two new dimensions in Flow Explorer to allow users to view the traffic flow for various infrastructure and services.

You may know such information from DPI (Deep Packet Inspection), which faces increasing challenges with scaling and encryption. BENOCS’ Application Identifier is a highly efficient and future-proof alternative.

Raw Network Analyzer

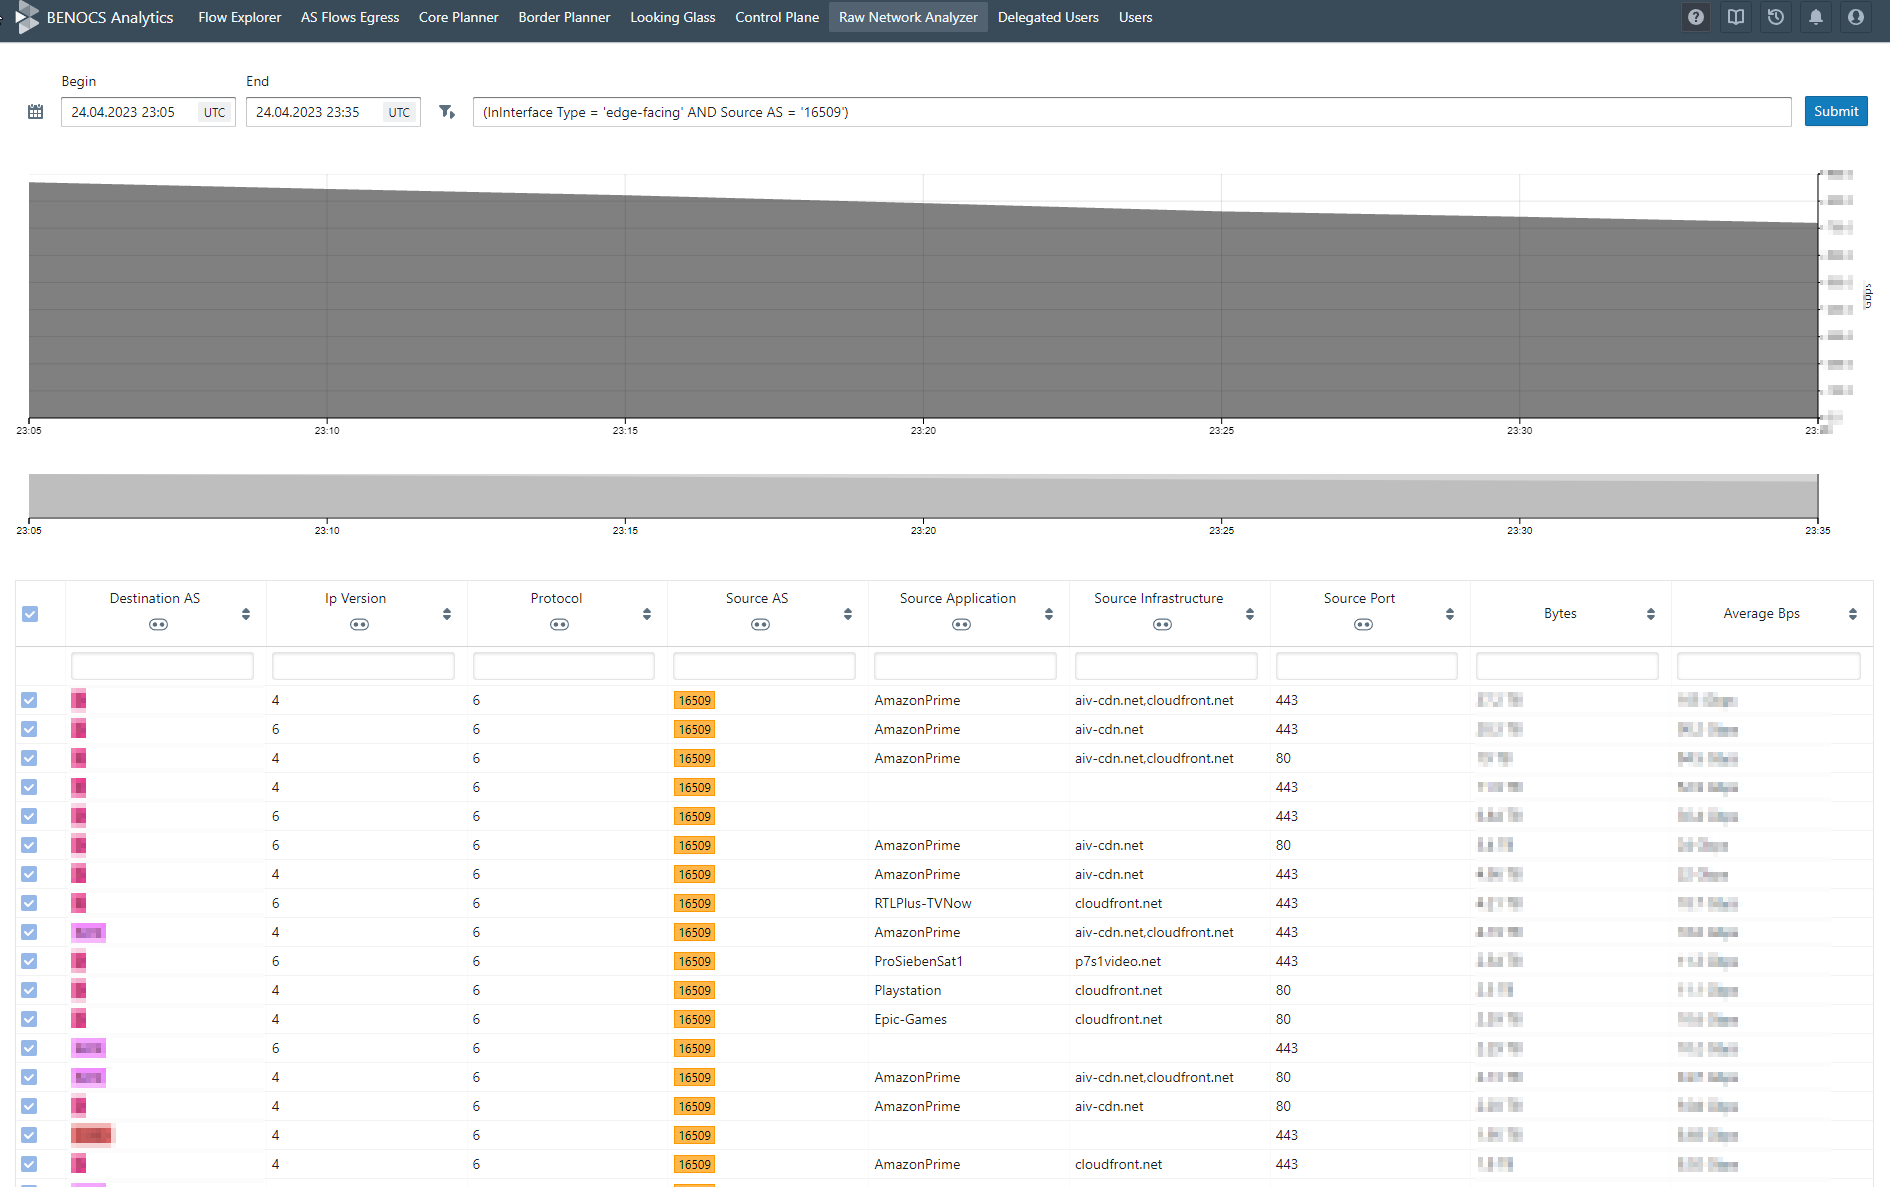
The Raw Network Analyzer module combines detailed raw flow data with BENOCS’ Core Engine aggregated data to unlock visibility on the IP-Subnet level and harness the real power of BENOCS Analytics. Users can build SQL-based advanced query filters to debug information such as IP Ports, Types of protocols, URL clusters, Type of Service, Sampling direction, v4 vs v6 split, and much more, across all dimensions.

Anomaly Alerts

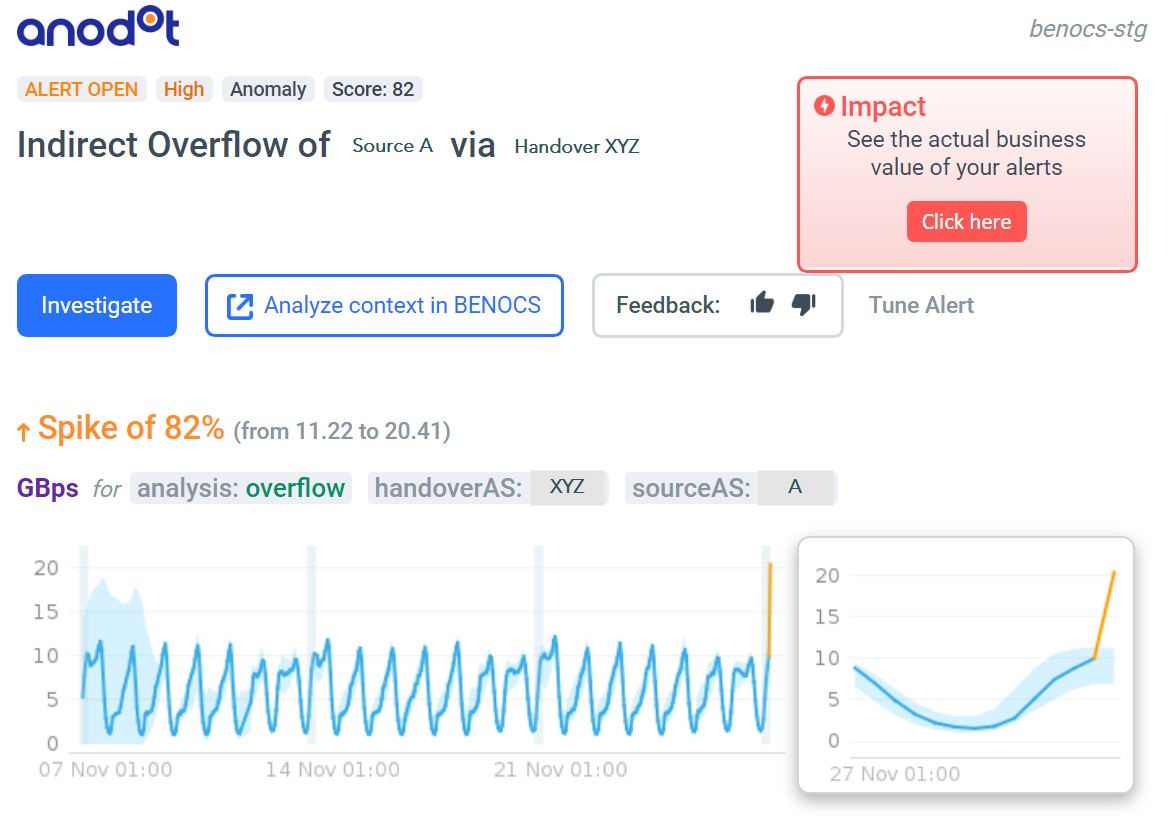
BENOCS Anomaly Alerts, powered by Anodot, learns normal traffic patterns in your network and automatically alerts you to anything out of the ordinary. Physical metrics such as interface in/out traffic, and even logical metrics like “all indirect Akamai traffic terminating in my mobile network” are pushed towards a machine-learning engine to get alerts when the traffic deviates from normal.

Alerts can be fine-tuned on severity levels and other parameters.

Do you want to see how BENOCS Flow Analytics works?

Back to Products